.png)
Current Market Environment
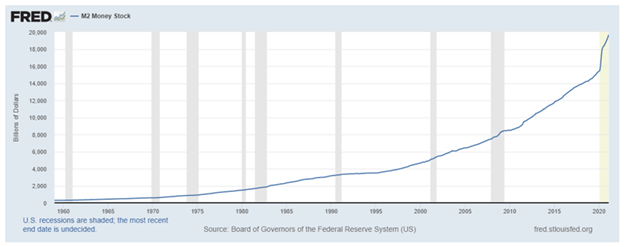
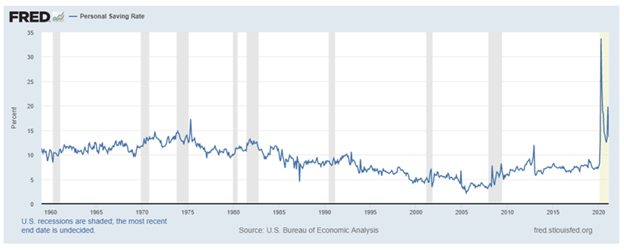
The new year began with the Georgia Senate runoff which saw both seats going to Democrats, thereby giving the Dems an effective majority in the Senate. Unshockingly, a new $1.9 trillion stimulus package was passed along party lines soon thereafter. The multi-trillions of dollars of government stimulus and additional trillions of monetary support by the Fed has left the United States awash in cash. As can be seen in the chart below, the U.S. money supply has skyrocketed, and stimulus checks have left the U.S. consumer with a considerable amount of cash in their pocketbooks.
The result of all of this has undoubtedly aided the rise in risk assets during the first few months of 2021, and has led to some speculative market actions that, to us, are reminiscent of the late-1990’s dotcom bubble. By way of example:
- Leadership of loss-making companies: As readers may recall, the latter stages of the dotcom bubble were marked by nascent companies, in many cases with barely more than a business plan, coming public at multi-billion dollar market caps and with valuations being rationalized by clicks, page views, or some similar metric. Similarly, the first two months (especially) of 2021 saw loss-making companies lead the market…in many cases being up hundreds of percent through February. For example, within the Russell 3000 Index, companies that reported losses over the trailing 12 months were up, on average, over 20% for the first two months of the year, while profit-reporting companies gained on average only 9%. More striking, the top 20 gainers in the index (each one in the loss-making category) were up an average of 226% - with every one of them appreciating over 100% for the first two months of the year.
- Rise of the retail trader: In January, a group of heavily-shorted stocks (some of which being questioned as viable going concerns prior to this) saw rapid price appreciation, driven largely by investors organizing on Reddit message boards in an effort to cause short squeezes, and thus dramatic increases in the prices of those stocks. This casino-like atmosphere was seemingly made easier by the rise of commissionless trading on apps such as Robinhood – giving traders the ability to transact endlessly at zero cost. As an acquaintance of ours who works in the restaurant industry, but was engaging in this trading activity put it: “It’s so easy; you log onto the message board in the morning, buy what they’re pitching, and just don’t get left holding the bag at the end of the day.” GameStop (GME), which became the “poster child” of this movement, saw its shares rise from a price of around $20 per share to a high of $483 in a matter of days and, echoing the period of the dotcom bubble, high profile investment managers could be seen on CNBC rationalizing the head-scratching valuations of these companies.
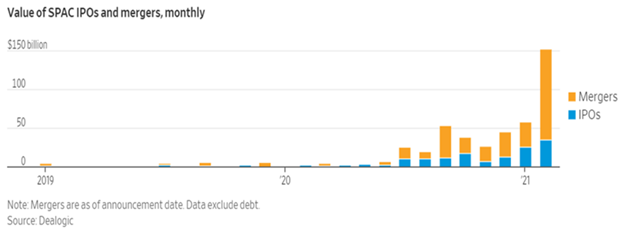
- “Blank check” companies: More formally known as SPACs (special purpose acquisition companies), have quickly risen to prominence as a preferred way for private companies to IPO with less red tape and cost. As the “blank check” moniker implies, these are public companies which raise capital from investors with the promise to eventually find a private company to purchase with those funds. Typically, this must be done within a two-year period, or the money is returned to shareholders. In just the first three months of 2021, literally hundreds of these SPACs have raised billions of dollars from investors and most of them are still looking for private companies to purchase. This didn’t stop many of them rising considerably above their IPO price, despite it being unknown what investors were really buying at the time. According to the Wall Street Journal (WSJ), at the end of March there were 430 SPACs looking for acquisition targets. Much like dotcom companies at the turn of the century seemed to fall under the weight of too much supply, as IPO after IPO came to market and 180-day lock ups expired, causing a flood of investors to look for the exits, the SPAC market risks a similar outcome. Indeed, after seeing average gains of over 5% in January and February (and 231 consecutive SPACs going public without dipping below their IPO price), the WSJ reported that SPACs rose merely 0.1% upon their debuts during March.
- Nonfungible tokens (NFTs) and digital currencies: Next on the list of hard-to-value assets that saw billions of dollars of money flow to during the first few months of 2021 are NFTs and digital currencies. While the long-term prospects of both of these types of assets could be debated, assessing a proper valuation to either of them currently comes down to “whatever the next person is willing to pay me.” And, much like the aforementioned loss-making companies, these two asset classes were caught up in the speculative frenzy which marked early 2021. For example, Bitcoin, which started the year just under $30,000 rallied to just under $60,000 at quarter end. And, NFTs, which are simplistically described as files which are attached to, and verify the authenticity of any digital item such as a video or music file, a GIF or a meme, etc., were being auctioned for exorbitant sums. For example, the first tweet ever, from Twitter cofounder Jack Dorsey was sold for a whopping $2.9 million (if you don’t want to dole out that sort of cash, feel free to scroll back to March 21, 2006 to see that tweet by @jack for yourself in his Twitter timeline).
As we entered March, the steam started to come out of some of these speculative assets. For example, taking a look at a broad index, loss-making companies in the Russell 3000 were down on average 3% in March in contrast to an average 5% gain for companies which posted profits over the trailing 12 months. Additionally, most of the stocks which were targeted on Reddit message boards have traded back down closer to where they were trading prior to the short squeezes (save for a handful of the more popular ones, including GME, which continue to trade much higher than before the frenzy, although significantly below their peak prices). As noted earlier, SPACs aren’t being met with nearly the same fanfare as they did earlier in the year, and the foreboding supply portends a questionable future for the over 400 still looking for a partner.
Meanwhile, starting mid-February, we saw a significant rotation from growth to value stocks, with the S&P 500 Value Index rising 10.8% during the quarter, while the Growth counterpart was up only 2.1%. This value outperformance was possibly a result of the 10-year Treasury‘s persistent rise and increased expectations for future inflation. As we’ve discussed in prior letters, it’s harder to justify ever-increasing valuations for fast-growing companies in an increasing interest rate environment. Will this rotation persist and be anywhere near the magnitude of what we’ve seen over the past 10 years+ of growth outperformance? Only time will tell, but boring as it may be in comparison to investing in tweets, we will continue with our process of searching for long-term investments in undervalued companies and will leave the investing in NFTs and the like to others.
Portfolio Addition – NuVasive:
To highlight one such “boring” portfolio addition in recent months, we initiated a position in the medical technology company NuVasive, Inc. (NUVA) starting in December and through January. NuVasive, which has a market capitalization of $3.4 billion, develops products, technology, and procedures for the spine surgery market. 2020 was a challenging year for NuVasive with the stock declining 40%+ by the time we began our research process. Spine procedures are generally deferrable, and as a result of COVID-19, volumes were down meaningfully and it was uncertain as to when they would rebound. However, by December we were gaining conviction in the eventual mass rollout of vaccines and the ability of hospitals and surgery centers to adapt to COVID implications – this gave us confidence the spine market would begin to rebound in 2021. We continue to believe that volumes are on a good track to accelerate, especially in the back half of this year.
We also have conviction that NuVasive has taken steps to reinvigorate its product offering. Historically, the company was the pioneer in minimally invasive lateral procedures and once commanded total market share. Today, their market share has declined to ~50% given competition from other spine companies and lack of innovation. They also are behind peers in launching a robotic application for surgeries. That said, NuVasive is reinvigorating its lineup by launching their largest and most comprehensive cervical product offering, and introducing surgery management hardware / software that will eventually integrate robotic-assisted surgeries in 2022. In total, 20+ products are expected to come to market in 2021. While NuVasive is one step behind select peers within robotic surgery and has received a valuation discount as a result, we believe this technology is over-hyped given roughly two out of ten procedures today are able to make effective use of a robot. We also like their recent tuck-in acquisition of Simplify, which is accretive to 2022 EPS and enhances their capabilities in the cervical total disc replacement segment.
The valuation profile of NuVasive in December was compelling, with the stock trading at 16x 2022E EPS and a near 5% free cash flow yield during our initial research period. In our estimation, expectations for the company were (and still are) low from Wall Street analysts and investors which is a net positive. The company is also underpenetrated internationally and is making good strides as Asia revenues grew double-digits in 2020 despite the pandemic. The aspirational goal of management is to double international revenue – as reference, international equates to approximately 20% of normalized sales. The company is also making commendable progress on their goal to expand the operating margin to 20%+ by 2024 via growth, expense saves, and operational efficiencies – this represents over 400 basis points of margin expansion versus 2019. Finally, we believe the stock has the opportunity to continue to re-rate as approximately half of its outstanding convertible notes and warrants are maturing / expiring this year (this has historically been an overhang for the stock). The balance sheet is in good shape to fund the maturity of the $650m March 2021 convertible notes.
Bank Investing Update
Last year was a rollercoaster for bank stocks. We were fortunate to be underweight the sector relative to our history heading into the pandemic. By March 2020, the regional bank index declined over 50% from the start of the year as the pandemic instilled fears of a major recession and credit losses not seen since the Great Financial Crisis. You may recall we began to warm back up to banks during Q3 2020 for a number of reasons and significantly increased net exposure. From the end of Q3 2020 to now, the regional bank index has increased 86% due to unprecedented stimulus, higher rates, the mass vaccination effort, benign credit quality, and a gradual return to normal.
The stunning performance over the past six months begs to ask the question “is the bank rally over”? While the “easy money” has been made, we believe the sector has further upside. Arguably the largest source of potential upside is the continued improvement in the interest rate environment. Last year, the 10-year Treasury yield hit an intra-day low of 32 basis points in March and has since rallied to 164 basis points. A continued increase in the long end of the curve is beneficial to reinvestment rates on securities and loan yields to retail customers. Inflation concerns are also starting to influence the market and there is discussion of a Fed Funds hike in 2022 - the Dallas Fed President expects a rate hike next year along with three other FOMC members. This would be a boon to the commercial banks in your portfolio which price commercial loans off short-term rates.
We are also encouraged by the resumption of bank merger activity in Q4 2020. In a post-COVID environment, achieving economies of scale and digital synergies via M&A (and internally for the matter) is a path to higher profitability. Attractive and well-structured deals have been rewarded as evidenced by your holding, PNC Financial Services Group Inc. (PNC). In November 2020, PNC announced the acquisition of BBVA USA, the deal being a good use of excess capital and 21% accretive to earnings. Since announcement, PNC has outperformed, returning 43% versus 37% for the BKX bank index. Based on conversations with management teams and commentary from investment bankers, we expect M&A to meaningfully accelerate. Anecdotally, the CEO of Toronto-Dominion stated he is “very open” to acquiring a U.S. regional lender, and multiple banks in your portfolio could be attractive targets and might command a significant premium. These holdings include KeyCorp, Comerica, First Horizon, and Synovus.
While loan growth has been muted given the impact of the pandemic and subdued economic activity, a continued recovery should be supportive of loan growth. Some bankers we’ve spoken with are optimistic regarding growth in the back half of 2021, given improving pipelines and conversations with potential borrowers. Notably, banks are sitting on excess amounts of liquidity and can meet a spike in loan demand. Banks are also resuming share repurchase programs and the Fed announced they will be removing temporary restrictions on shareholder returns for most banks on June 30th. As a result, it’s possible for some banks to achieve mid to high-single digit yields on dividends + buybacks relative to current prices, which we view as highly attractive in today’s market environment.
Despite these tailwinds, the sector retains defensive attributes as mentioned in previous letters. To summarize, banks remain overcapitalized relative to history, even with massive loss reserves built over the course of 2020 (which we expect to be released over time). The sector continues to retain low-risk loan books and is awash in excess liquidity given government and monetary stimulus. While valuations for the sector have recovered from bottom decile relative to history, they remain inexpensive. Since 1992, bank stocks remain cheap at the 26th percentile at just under 13x forward earnings. On a price-to-tangible-book-value basis, the sector is valued below average at the 42nd percentile or 1.9x. Assuming the aforementioned earnings tailwinds continue to take hold and multiples expand, there is meaningful upside. For aspirational purposes, at the 70th percentile of historical valuations, the sector would command a P/E of 16x and 3.3x on a price-to-tangible-book-value basis.
Outlook
2021 looks to be a transitional year. We are clearly in the early stages of a new economic cycle, following the coronavirus-induced recession of 2020. Continued progress on vaccinations will allow the U.S. economy to return to more familiar footing with the resumption of dining out, air travel for business and pleasure, and large group gatherings. The recent United States elections, although closely contested, have ushered in a change in administration with attendant changes in the agenda around stimulus, spending, taxes, and trade. The razor-thin margins in Congress are likely to temper any radical policy shifts. Importantly the volatility emanating from the executive branch should ease.
While interest and mortgage rates have lifted, they are coming off historically low levels, while inflation remains below target. We see early signs of reinflation in Treasury and TIP yields from the historically high levels of government spending here and around the world. We are carefully monitoring aggregate corporate debt levels (especially BBB- debt which is a single notch above junk status), currently above pre-2008 crisis levels and loom as a potential problem absent continued aggressive Fed support. Unemployment has shown significant improvement, but continues to be an issue.
In our estimation, overall equity valuations remain at elevated levels, due to the sharp rebound in equities, which has outpaced prospective positive earnings revisions. The high valuations of a small number of enormous technology companies certainly exert upward pressure to the overall averages. Recovery in aggregate earnings will take time as certain industries such as hospitality, entertainment, and travel are tied to the success of a vaccine rollout plan, and will take longer to return to pre-coronavirus levels. Treasury and high-grade corporate bond yields look unattractive after the dramatic flight to safety rally during 2020. In any case, value investing is ripe for a continued period of outperformance, and the bargains inherent in your portfolio should attract acquirers and other investors over time. Meanwhile, we still believe equities represent a superior asset allocation alternative to bonds over the longer term.
Steadfast, we remain committed to making you money while aiming to protect your wealth.
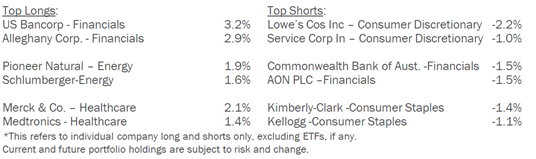
Portfolio Overview – as of 3/31/21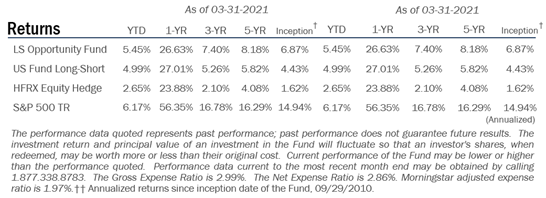
Top Holdings By Sector – as of 3/31/21
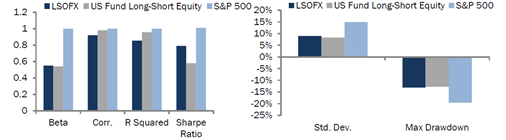
Risk Characteristics – as of 3/31/21
Disclosures
†† The Morningstar Rating for funds, or "star rating", is calculated for managed products (including mutual funds, variable annuity and variable life subaccounts, exchange-traded funds, closed-end funds, and separate accounts) with at least a three-year history Exchange-traded funds and open-ended mutual funds are considered a single population for comparative purposes It is calculated based on a Morningstar Risk-Adjusted Return measure that accounts for variation in a managed product's monthly excess performance, placing more emphasis on downward variations and rewarding consistent performance The top 10% of products in each product category received 5 stars, the next 22 5% receive 4 stars, the next 35% receive 3 stars, the next 22 5% receive 2 stars, and the bottom 10% receive 1 star. The Overall Morningstar Rating for a managed product is derived from a weighted average of the performance figures associated with its three-, five-, and 10-year (if applicable) Morningstar Rating metrics The weights are: 100% three-year rating for 36-59 months of total returns, 60% five-year rating/40% three-year rating for 60-119 months of total returns, and 50% 10-year rating/30% five-year rating/20% three-year rating for 120 or more months of total returns While the 10-year overall star rating formula seems to give the most weight to the 10-year period, the most recent three-year period actually has the greatest impact because it is included in all three rating periods. Across the US Long Short Equity category, the LS Opportunity Fund received 3 stars among 180 funds, 4 stars among 153 funds, and 4 stars among 48 funds for the 3-, 5-, and 10-year periods, respectively.
Past performance is not a guarantee of future results.
Important Risk Information
Investment in shares of a long/short equity fund have the potential for significant risk and volatility. A short equity strategy can diminish returns in a rising market as well as having the potential for unlimited losses. These types of funds typically have a high portfolio turnover that could increase transaction costs and cause short-term capital gains to be realized.
The stocks in the Fund’s portfolio may decline in value or not increase in value when the stock market in general is increasing or decreasing in value and you could lose money.
The Fund may lose money due to fluctuations within the stock market which may be unrelated to individual issuers and could not have been predicted. The price of the securities which the Fund holds may change unpredictably and due to local, regional, international, or global events. In the case of a general market downturn, multiple asset classes, or the entire market, may be negatively affected for an extended and unknown amount of time.
Risk Statistic Definitions:
Standard Deviation measures the volatility of the Fund’s returns. Beta measures the Fund’s sensitivity to market movements. Sharpe Ratio uses the Fund’s standard deviation and average excess return over the risk-free rate to determine reward per unit of risk. R-squared represents the percentage of the portfolio’s movements that can be explained by general market movements. Upside/Downside Capture Ratio measures a manager’s ability to generate an excess return above the benchmark return in up markets and retain more of the excess return in down markets. Risk statistics are relative to the S&P 500. Batting Average is a statistical measure used to evaluate an investment manager’s ability to meet or beat their index. Omega is a relative measure of the likelihood of achieving a given return. Max Drawdown is the peak-to-trough decline during a specific recorded period of an investment. Gross Exposure is the sum of the absolute values of the fund’s long and short exposures.
Net Exposure is the fund’s total long exposure less the fund’s total short exposure. The Expense Ratio, Gross of Any Fee Waivers or Expense Reimbursements, is 2.99%. The Expense Ratio, Net of Fee Waivers and Expense Reimbursements (contractual through 9/30/2021), is 2.86%. The Morningstar expense cap ratio, which reflects what the investor would have paid, is 1.97%.The Expense Cap is 1.95%. The Adviser has contractually agreed to waive or limit its fees to 1.95% and to assume other expenses of the Fund until September 30, 2021, so that the ratio of total annual operating expenses (not including interest, taxes, brokerage commissions, other expenditures which are capitalized in accordance with generally accepted accounting principles, other extraordinary expenses not incurred in the ordinary course of business, dividend expenses on short sales, expenses incurred under a Rule 12b-1 plan, acquired fund fees and expenses and expenses that the Fund incurred but did not actually pay because of an expense offset arrangement) does not exceed 1.95%.
Prospector Partners, LLC assumed investment management duties on 05-28-2015 and was formally approved by shareholders on 09-17-2015.
Effective November 30, 2020, the Morningstar US Long Short Fund Index replaced the HFRX Equity Hedge Index as the Fund's performance benchmark because the Morningstar US Long Short Fund more closely aligns with the Fund's investment strategy and portfolio composition.
You should carefully consider the investment objectives, potential risks, management fees, and charges and expenses of the Fund before investing. The Fund’s prospectus contains this and other information about the Fund, and should be read carefully before investing. You may obtain a current copy of the Fund’s prospectus by calling 1.877.336.6763.
The Fund is distributed by Ultimus Fund Distributors, LLC. (Member FINRA).
12716621-UFD-4/26/2021