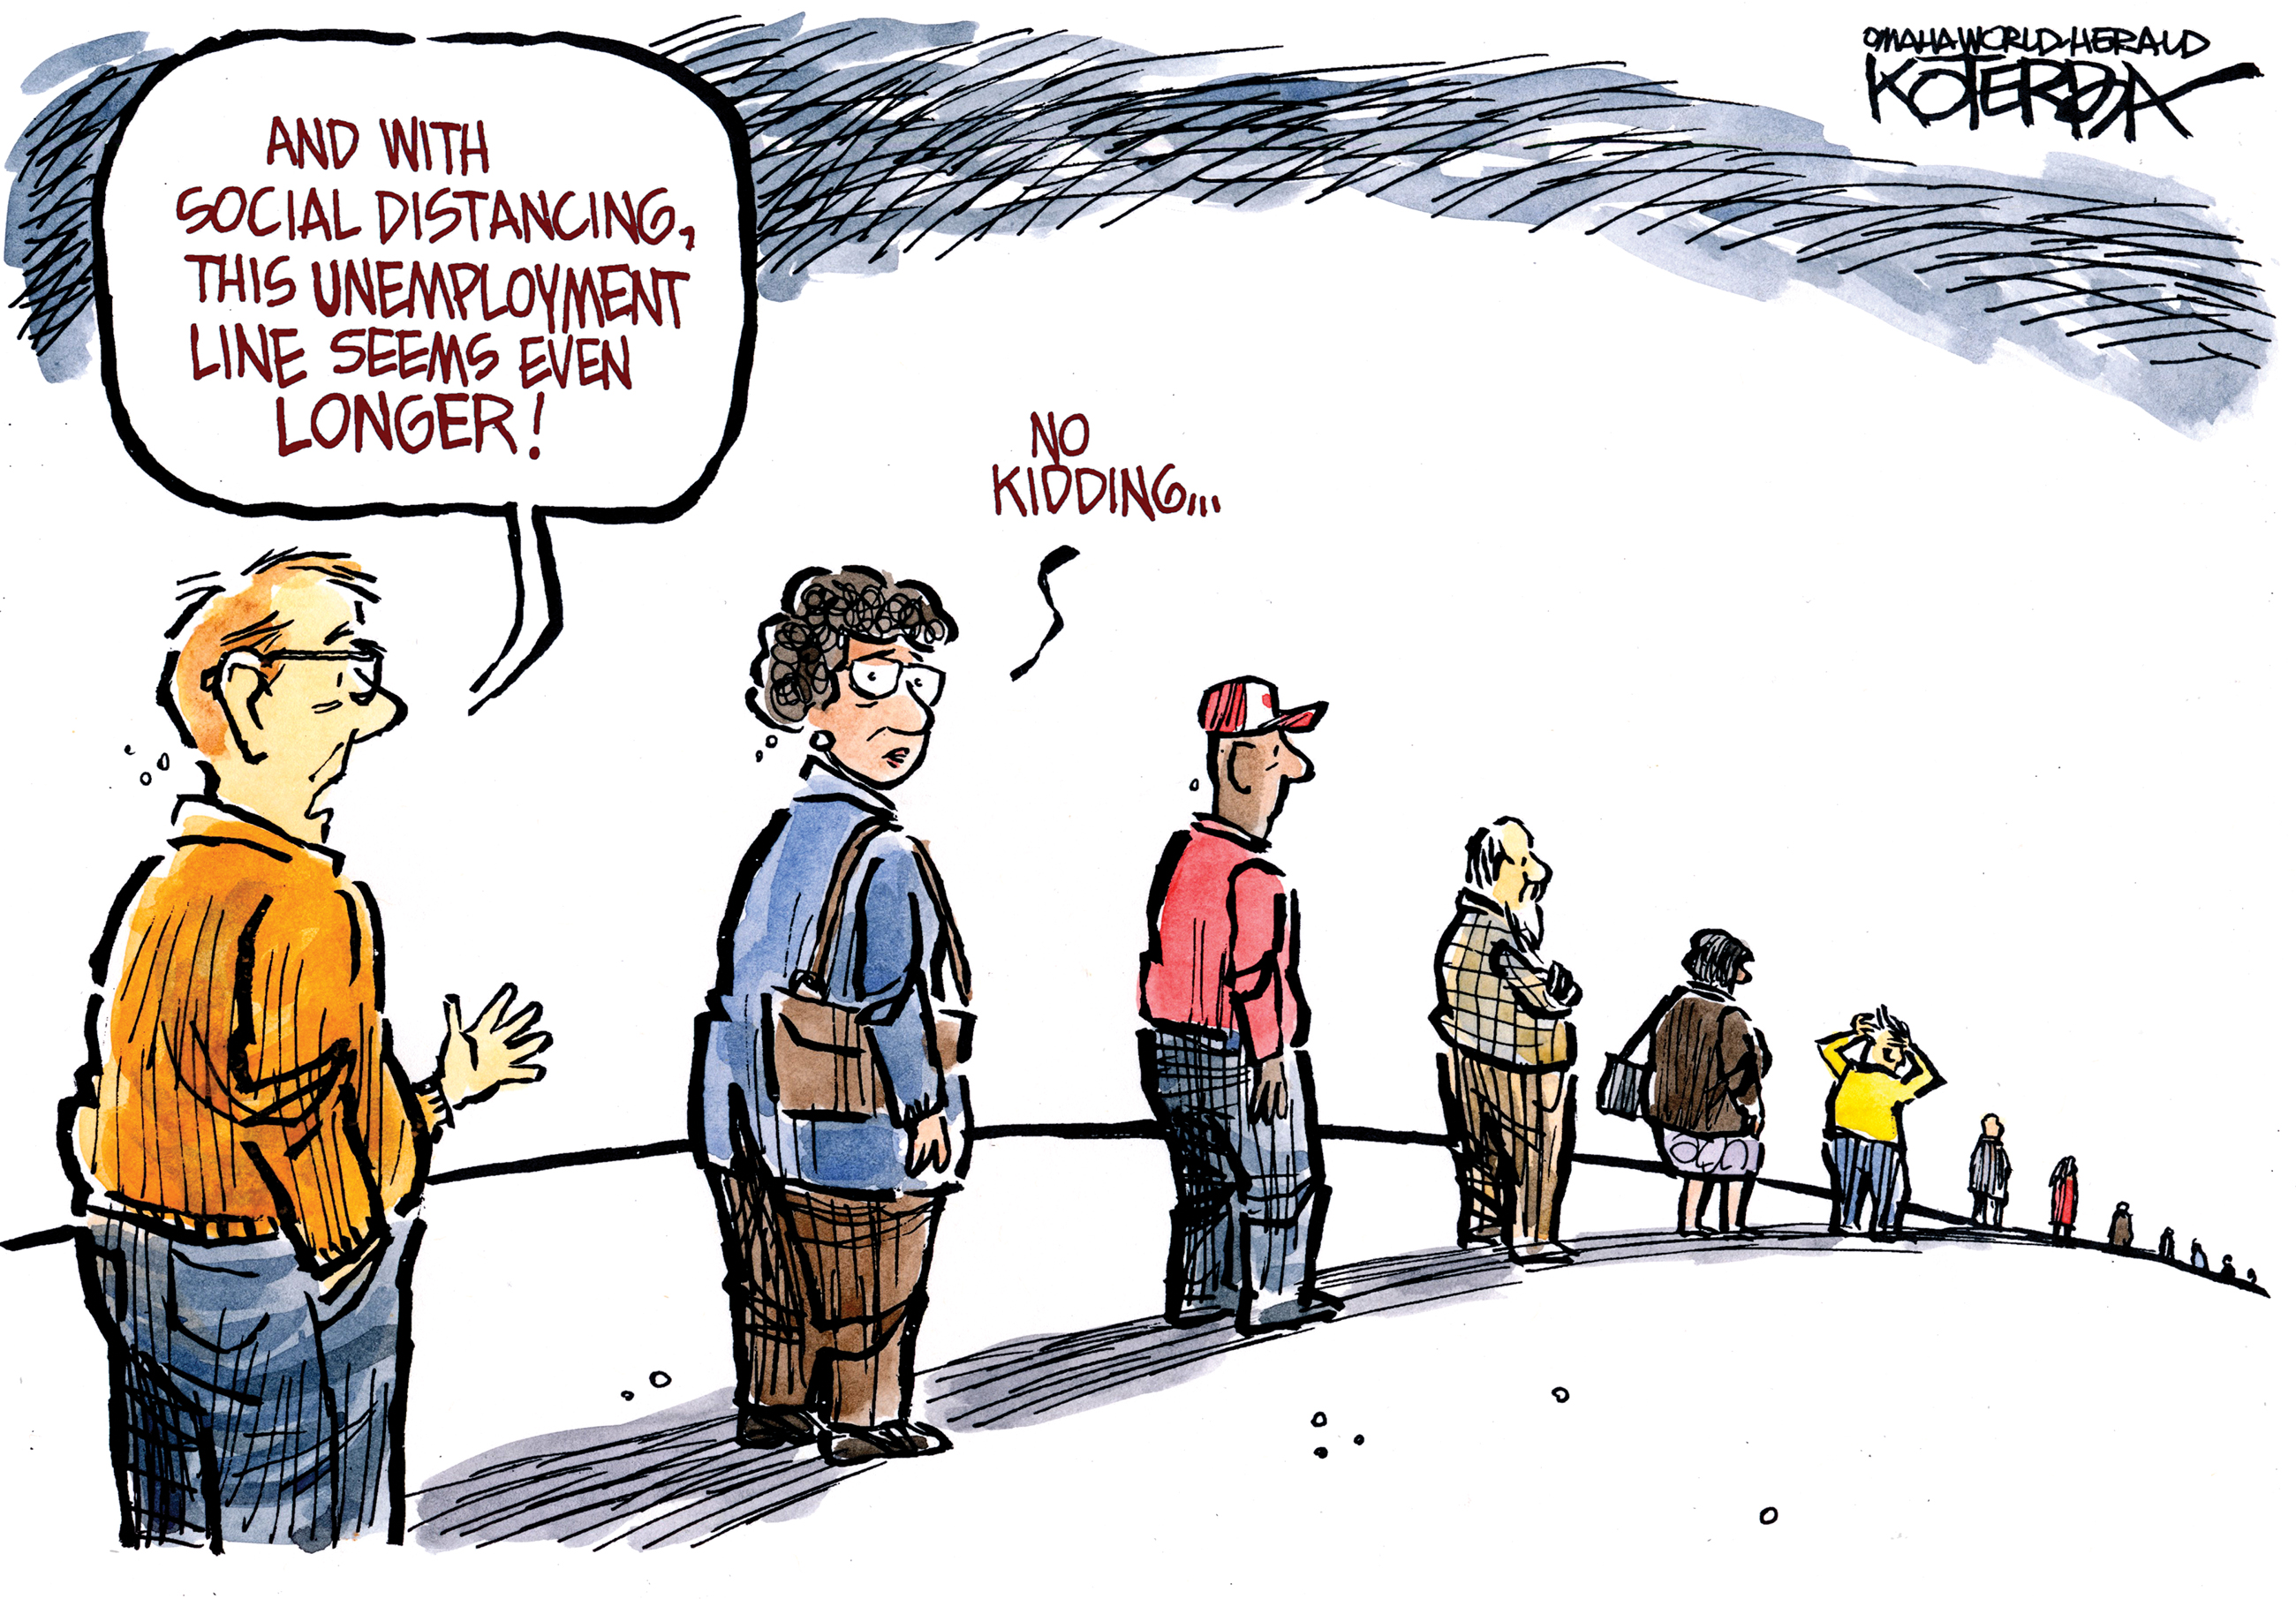
The COVID-19 global pandemic continued to have massive implications during the second quarter, as cases continued to rapidly rise in the United States. The unemployment rate reached 14.7% in April, and U.S. GDP is estimated to have contracted by 35% in the quarter after falling 5% in the first three months of the year.
On top of this, the spring and early summer saw dramatic civil unrest domestically as well as in areas of Europe. U.S. relations with China worsened, polls increasingly pointed to a potential Democratic sweep of the Presidency and both houses of congress in the upcoming November election, which could portend higher taxes, increased regulation, and an overall less favorable climate for business. Against this foreboding backdrop, the S&P 500 had its best quarter since 4Q98 - ending June down 9% from its all-time high and returning over 20% in the quarter.
This incongruity is most likely the result of massive global stimulus, which injected a never before seen amount of liquidity into the market. The phrase “don’t fight the Fed” has never been more apt. Indeed, Bank of America has estimated the global fiscal and monetary response to the pandemic-induced slowdown at $18 trillion…and we’re not done yet. With so much excess liquidity in the system, any positive news about a potential vaccine or treatment for COVID-19, or potential for reopening the economy was met with great fanfare by the market. This despite an increasing number of COVID-19 hotspots emerging across the country as states began to reopen, giving rise to questions regarding whether the country will have to go back into lockdown as northerners head back indoors in the fall and winter. Bad news has been largely ignored, and good news cheered - one had the sense that a fear of missing out (FOMO) was driving investor behavior more than underlying fundamentals during the period.
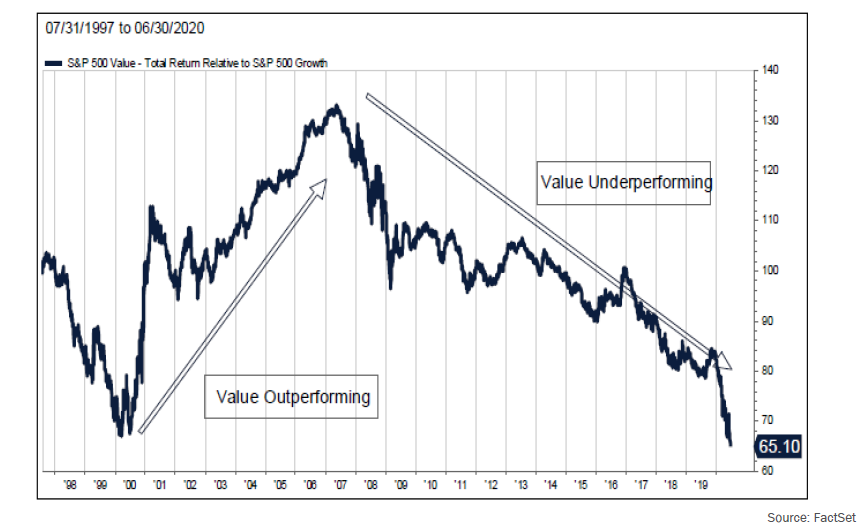
Nowhere was this FOMO more apparent than in technology stocks, which, having led the market for much of the past decade, continued to outpace. “FAANG” companies Facebook, Apple, Amazon, Netflix, and Google’s parent, Alphabet, returned 36%, 44%, 42%, 21%, and 22% in the second quarter respectively. Investors rationalized ever-increasing valuation multiples, viewing these companies and their tech cohorts as relative winners from a “stay at home” economy. Indeed, the sector (plus Amazon) contributed roughly half of the S&P 500’s return during the period. While many of these companies are beneficiaries from the work from home trend, increased internet use, move to the cloud, etc., many of these stocks are reaching near mania valuation levels reminiscent of the “dot com” bubble of the late-90’s. This also continues the trend of the market placing ever-increasing premiums on companies that exhibit appreciable amounts of growth. By way of reference, as can be seen in the charts below, the disparity between growth stocks and value stocks is wider than it has been since those frothy dotcom days.
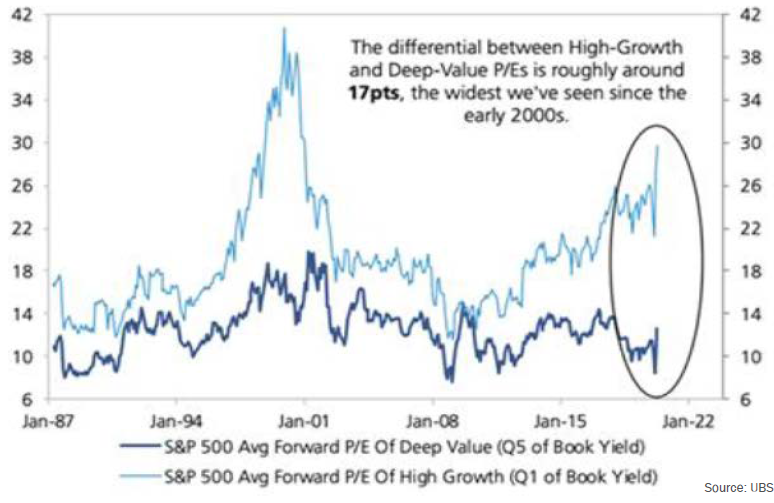
We remind investors that following the bursting of that tech stock bubble, value stocks significantly outperformed their growth brethren for the next seven years.
Property-casualty Update
In the world of (re)insurance, every major catastrophe leaves its residual impact on the industry, and COVID-19 will do the same. The lessons learned from Hurricane Andrew, September 11th, Hurricane Katrina, and many others, yield prospective changes in insurance companies’ risk appetites, capital requirements, and importantly, prospective assessment for pricing adequacy. The investment community response to these mega events typically follows the same pattern. Property-casualty stocks initially decline, as focus is placed on assessing the losses incurred by the industry and individual companies, and the remaining capital adequacy. Once the losses can be ascertained, investor focus shifts to prospective pricing improvements and the stocks typically perform well, as future earnings improvement is discounted into current valuations. We expect this playbook to unfold once again.
However, COVID-19 is a “live” event and ultimate losses to the industry are difficult to quantify. Estimated “ranges” of loss from experts remain incredibly wide and investors are unlikely to focus on prospective pricing improvement until a clearer picture of loss impact can be reasonably quantified. Reported results in the 2Q20 may give us some answers, as management teams likely have a better handle on ultimate exposures than three months ago. There have been a couple of court decisions regarding interpretations of policy coverage for business interruption (an industry exposure most difficult to quantify) that suggest industry losses could be at the lower end of the wide range of estimates, but it is still early in this process. Clarity on COVID-19 would likely initiate an improvement in investor interest, but COVID-19 is not the only near-term issue. The 2Q20 was an active one for storm activity in many regions of the U.S. and reported losses are likely to be meaningful. Oh, and we are in the middle of what is expected to be a very active hurricane season.
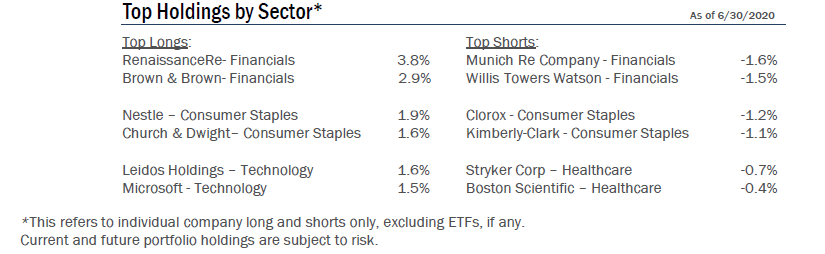
Reinsurance renewals in June and July are material (seasonally) and price increases were meaningful. Importantly, terms and conditions were also tightened/improved. The aforementioned uncertainty has already translated into reinsurance company behavior changes that are likely to improve prospective returns. We are confident that investor interest in the space will improve as this period of uncertainty passes. Valuations are attractive and pricing power is likely to persist throughout our investable timeframe. We have made several adjustments to your portfolio, by reducing short positions, adding to existing long positions, and initiating a new long position in Alleghany Corporation (Y), a company with a conservative balance sheet, attractive valuation, and significant presence in markets undergoing profitability improvement. The sector remains one of our higher conviction investment themes in these uncertain times.
Swapping Cyclicals
In last quarter’s letter, we described the reasoning behind our reducing exposure to banks. With that reduction in cyclical exposure, we opted to add to industrial names we view as conservative but with exposure to an economic cyclical recovery. Among the names we invested in were PPG Industries Inc. (PPG), Otis Worldwide Corp (OTIS), and General Dynamics Corp (GD).
PPG is the world’s second largest manufacturer of paints and coatings. Roughly one third of the business serves the architectural markets with such brand names as PPG, Pittsburgh Paints, Olympic, and Liquid Nails. About another third serves the automotive and automotive repair markets, while the remainder supports a wide array of highly demanding industrial coatings markets such as in aerospace and marine. The company’s exposures to automotive and industrial markets resulted in it underperforming peers that were more architectural in their orientation. However, we believe that the auto industry will recover as it always has before, and we believe the paint shop remains the most critical part of an automotive assembly plant. Paint is key to appearance. We also believe PPG is the global leader in industrial coatings with important science and materials-based knowledge critical to aerospace and similarly demanding environments. These sectors will likely recover too.
Otis is one of the leaders in the global elevator and escalator industry. Otis is now a pure play on this highly attractive industry after it was spun out from the recent breakup of United Technologies Corporation. Otis and its peers are very attractive and conservative cyclicals due to the vast bulk of profits coming from recurring aftermarket parts and services. Because the consequences of deferring elevator maintenance are so potentially disastrous, deferrals are extremely rare. Otis and its peers deliver strong cash flows even in the worst of times, such as these.
General Dynamics is a leading defense prime contractor, with strong positions in submarines, surface ships, information technology services, combat vehicles, and munitions. It is also the parent of Gulfstream Aerospace, the premier business jet manufacturer. Gulfstream was 25% of sales in 2019. GD’s stock underperformed peers this year due to the expectation that business jet sales will be down this year due to the pandemic. But what we see is an industry leading franchise selling at an attractive price. We believe business jet travel will recover, and in the next cycle the business may possibly exceed the last cycle due to the pandemic highlighting the privacy and social distancing opportunities private jet travel offers. In fact, while commercial air traffic remains far below 2019 levels today, business jet travel has recovered much quicker, and on certain days it already matches 2019 levels.
These three portfolio additions produce solid cash flows, have good balance sheets, and are poised for solid growth in an economic recovery. Meanwhile, we believe our entry points provide a good margin of safety should COVID-19 cause an extended economic downturn.
Outlook
The range of outcomes in the short to intermediate term is wide and hinges on the imminent outcome of the “bending the curve” effort to curtail the COVID-19 pandemic. Economic contraction, trade and geopolitical concerns weigh heavily. The upcoming United States presidential election is right around the corner and a shift in power could prolong market volatility.
Interest and mortgage rates continue near historically low levels, inflation is non-existent, and a recession is here. We are carefully monitoring aggregate corporate debt levels (especially BBB- debt which is a single notch above junk status), which now sit above pre-2008 crisis levels and loom as a problem without aggressive Fed buying through the latest quantitative easing program. Unemployment has also spiked to double digit levels and has not yet stabilized.
In our estimation, equity valuations remain at elevated levels, due to the sharp decline in expected earnings for the rest of 2020 and into 2021, and the sharp rebound in equities. Recovery in aggregate earnings will be slow as certain industries such as hospitality, entertainment, banking, and travel will take much longer to return to pre-coronavirus levels. Treasury and high-grade corporate bond yields look unattractive after the dramatic flight to safety rally during the current health crisis. In any case, the values inherent in your portfolio should attract acquirers and other investors over time. Meanwhile, we still believe equities are a superior asset allocation alternative to bonds over the longer term.
Steadfast, we remain committed to making you money while aiming to protect your wealth…
Disclosures
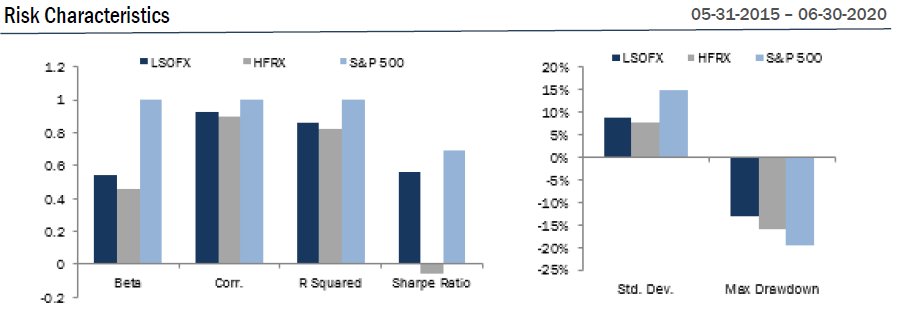
Risk Statistic Definitions: Standard Deviation measures the volatility of the Fund’s returns. Beta measures the Fund’s sensitivity to market movements. Sharpe Ratio uses the Fund’s standard deviation and average excess return over the risk-free rate to determine reward per unit of risk. R-squared represents the percentage of the portfolio’s movements that can be explained by general market movements. Upside/Downside Capture Ratio measures a manager’s ability to generate an excess return above the benchmark return in up markets and retain more of the excess return in down markets. Risk statistics are relative to the HFRX. Batting Average is a statistical measure used to evaluate an investment manager’s ability to meet or beat their index. Traynor Ratio measures excess returns per each unit of market risk, as measured by beta. Omega is a relative measure of the likelihood of achieving a given return. Max Drawdown is the peak-to-trough decline during a specific recorded period of an investment. Gross Exposure is the sum of the absolute values of the fund’s long and short exposures. Net Exposure is the fund’s total long exposure less the fund’s total short exposure. The Gross
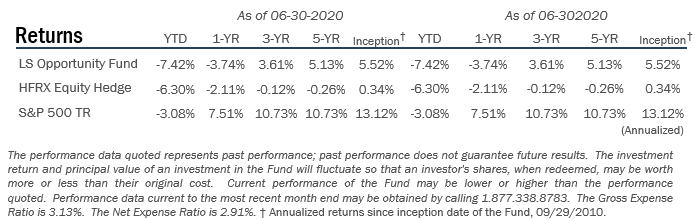
Expense Ratio is 3.13%. The Net Expense Ratio is 2.91%.The Expense Cap is 1.95%. The Adviser has contractually agreed to waive or limit its fees to 1.95%.
Prospector Partners, LLC assumed investment management duties on 05-28-2015 and was formally approved by shareholders on 09-17-2015.
As of 3/31/2020, the Fund contained 63 long positions in the portfolio representing companies with what management believes represents long-term value and favorable characteristics such as a discount to market value, attractive free cash flow yields, and strong balance sheets. The Fund’s top 10 long positions represented approximately 26% of the portfolio and included Aflac (AFL – 2.0%), Berkshire Hathaway (BRK.B – 3.2%), Brown & Brown (BRO – 3.3%), Merck & Company (MRK) – 2.1%), Microsoft (MSFT – 2.2%), Nestle (NESN – 2.7%), PNC Financial (PNC – 2.5%), Progressive Corp (PGR – 2.3%), RenaissanceRe (RNR – 3.6%), and US Bancorp (USB – 2.1%).
The Fund may lose money due to fluctuations within the stock market which may be unrelated to individual issuers and could not have been predicted. The price of the securities which the Fund holds may change unpredictably and due to local, regional, international, or global events. These events may include economic downturns such as recessions or depressions; natural occurrences such as natural disasters, epidemics or pandemics; acts of violence such as terrorism or war; and political and social unrest. Due to the prominence of globalization and global trade, the securities held by the Fund may be affected by international and global events. In the case of a general market downturn, multiple asset classes, or the entire market, may be negatively affected for an extended and unknown amount of time. Although all securities are subject to these risk, different securities will be affected in different manners depending on the event.
The Expense Cap is 1.95%. The Adviser has contractually agreed to waive or limit its fees to 1.95% and to assume other expenses of the Fund until September 30, 2020, so that the ratio of total annual operating expenses (not including interest, taxes, brokerage commissions, other expenditures which are capitalized in accordance with generally accepted accounting principles, other extraordinary expenses not incurred in the ordinary course of business, dividend expenses on short sales, expenses incurred under a Rule 12b-1 plan, acquired fund fees and expenses and expenses that the Fund incurred but did not actually pay because of an expense offset arrangement) does not exceed 1.95%.
Investment in shares of a long/short equity fund has the potential for significant risk and volatility. A short equity strategy can diminish returns in a rising market as well as having the potential for unlimited losses. These types of funds typically have a high portfolio turnover that could increase transaction costs and cause short-term capital gains to be realized.
You should carefully consider the investment objectives, potential risks, management fees, and charges and expenses of the Fund before investing. The Fund’s prospectus contains this and other information about the Fund, and should be read carefully before investing. You may obtain a current copy of the Fund’s prospectus by calling 1.877.336.6763. The Fund is distributed by Ultimus Fund Distributors, LLC. (Member FINRA).
10713787-UFD-7/29/2020