Current Market Environment
Transitory. Anyone following the markets during the second quarter heard the word bandied about ad nauseam, and the question of whether inflation would serve to be temporary (transitory) or more permanent drove the daily movements of the market. Indeed, the quarter began with a Consumer Price Index (CPI) reading that showed heightened levels of inflation, with March CPI jumping 2.6%, fueled by an economy that was rapidly expanding due to increased vaccination rates, reopening of businesses, and continued stimulus. The debate over “transitory or not” quickly heated up, with every economic reading being scrutinized as to whether it was indicative of more persistent inflation. If inflationary, then the 10- year Treasury would sell off, value stocks would lead growth, and vice versa. The April CPI reading jumped again, this time to 4.2%, followed by 5.0% for May and June’s 5.4% - the highest reading since August 2008. Despite these readings, the markets seemed to vote “transitory” as long-term bond yields came off the late March highs, and the yield curve began to flatten. This was exacerbated when Fed chairman Jay Powell indicated during the June meeting that they would expect to raise rates earlier than previously planned (albeit not until 2023), eliciting fears of a prematurely hawkish Fed pouring cold water on the current economic expansion. The 10-year yield, which ended March at 1.74%, sank to 1.47% at June 30, and the yield curve flattened considerably. This also caused investors to pile back into growth stocks and sell interest-rate sensitive stocks (for example, banks and other financials) as a consensus developed that we were poised to be in a persistently low interest rate environment. As discussed in previous writings, lower long-term yields tend to favor higher-growth companies as future earnings are discounted at lower rates. So, is the market right? Will inflation serve to be transitory despite the rapid economic expansion and unprecedented stimulus, and thus are we destined for a semi-permanent low-interest rate future? Before a conclusion is reached, we believe the following additional questions will likely need to be answered:
What will be the long-term impact of materials, goods and labor shortages?
By this point, we have all likely experienced some impact from recent shortages of products, materials or labor. If you were looking to build a deck, or a similar project, you surely noticed the impact as lumber prices soared to over $1,600 per thousand board feet from under $400 a year prior. In the market for a car? You’ve likely had trouble finding one, and / or noticed the sky-high prices of what is actually available. A confluence of pandemic-related events has led to shortages of lumber, autos (due largely to a lack of semiconductor supply), and many other products. When the pandemic hit, manufacturers shut down plants, sawmills, etc., laying off workers in the process. In a normal recovery, these plants and mills slowly come back online as the economy gradually improves. However, during this unprecedented v-shaped recovery, supply has been unable to recover as quickly as demand – creating these product shortages. Additionally, this has been compounded by a labor shortage despite continued high levels of unemployment. Whether because out of work individuals are reluctant to go back to work due to ongoing COVID-19 concerns, the lack of child care, or the ongoing stimulus payments they are receiving, many companies are finding it hard to re-staff their factories, shops, restaurants, etc. Many restaurants have been forced to open on a limited schedule due to staffing shortages.
While many of these shortages will work their way through the system, proving to be temporary (e.g., lumber prices are back to just under $600 as mills have come back online or ramped up production), it remains to be seen how much will last longer term. Prices are increasing on products as companies attempt to keep up with input cost pressures, and businesses are being forced to raise wages to entice new employees. Will these price increases reverse as supply chains stabilize and will wage pressures abate as enhanced unemployment benefits roll off in the fall, causing some unemployed Americans to start looking for jobs again? And not to be overlooked, given rents make up about one third of CPI – will the July 31st end to the moratorium on evictions, enabling landlords to adjust leases, cause a significant rise in rents? Only time will tell.
Are interest rates artificially low due to Fed asset purchases?
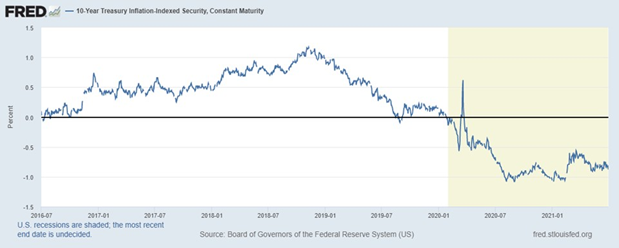
As can be seen in the chart above, we’ve been in a persistently negative real rate environment since the beginning of the pandemic, with rates staying persistently low despite the economy’s rapid recovery. We do not purport to be economists, but one macro-economist we respect suggests this may be partially the result of Fed asset purchases, and thus may lead to a rise in rates as asset purchases abate. Mike Darda, of MKM Securities, points out in recent notes that the real yield of 10-year inflation-protected securities has averaged about 25 basis points over a long period. According to Darda, assuming inflation expectations of about 2% hold steady (recall, the Fed has indicated a willingness to allow inflation to go over 2% for a period), “that would mean the 10-year yield would climb to 2.3% or so.” Adding some weight to this theory, JP Morgan recently noted, “…from the start of 2021 through May 2021, the Federal Reserve’s Treasury purchase of $80B per month has totaled $400B YTD, or roughly equal to the total net issuance of Treasury securities of $415B. As of May, the Fed held 24% of total Treasuries outstanding and up from 15% in February 2020 (pre-pandemic).” Should the Fed begin to limit asset purchases, it seems plausible yields will rise in response.
Will we get more stimulus in the form of an infrastructure bill?
As referenced earlier, we have already flooded the economy with unprecedented stimulus. To date, an estimated $5 trillion has been injected into the economy by the U.S. government, equal to 24% of GDP. This compares to $1.6 trillion during the Great Financial Crisis, or 11% of GDP, of which a large portion was aimed at stabilizing the financial system versus directly stimulating the economy. This is in contrast to the pandemic-induced stimulus program, of which much went directly into consumer pockets (via checks, school lunch aid, unemployment insurance, etc.) and to small businesses (PPP Program, Economic Injury Disaster Loans, etc.). This stimulus has unquestionably aided the current “v-shaped” recovery.
An infrastructure bill could add an additional boost to an already rapidly expanding economy, and while President Biden announced a bipartisan agreement on a $1.2 trillion infrastructure deal on June 24th, we would not cast aspersions at those who are dubious any such agreement will pass. However, if a bipartisan deal doesn’t pass, the likelihood increases that a Democrat simple-majority bill is pushed through via the budget reconciliation process. Should this occur, it’s more than likely the package would be much larger than a bipartisan deal, potentially in the multiple trillions. While controversial in a gridlocked Washington, where more and more gets pushed through via executive orders, and via the budget reconciliation process, a larger infrastructure deal would surely add more fuel to the economy, and raise the specter of increased inflation.
Will a COVID strain break through the vaccine, causing a major resurgence?
Even if the aforementioned scenarios all point in the direction of rising interest rates, the wildcard will be if we see a resurgence of COVID-19. Recently, concerns over the “Delta” COVID-19 variant have weighed down the market and contributed to the rally in Treasuries, further depressing interest rates. There have also been reports of a “Lambda” variant, that has hit some South American countries and even Canada, and is anecdotally more severe than even the Delta variant. Should one or more of these variants cause the vaccines to prove ineffective, we could see slowdown, or even a double-dip recession. More than likely however, this would lead to another flood of government stimulus, and just delay the expansion as vaccine boosters effective against the new strains are developed. The added stimulus and continued ballooning of the U.S. balance sheet would further stack the deck in favor of an inflationary period and increased rates down the road, albeit delayed by the virus.
So, what does this all mean for the Fund? While your portfolio would, in our estimation, benefit from any rise in interest rates and steepening of the yield curve, that is not a main thesis for portfolio holdings or sector bets. The same could be said as it relates to inflation. For example, we are overweight banks - a sector which would surely benefit from rising interest rates and a steeper yield curve (as net interest margins would expand). However, as we have stated in prior communications, we feel there are multiple other “ways to win” with the banks in your portfolio...including a significant capacity to grow loans as the economy continues to expand, the potential to return material amounts of capital to shareholders or be acquired, as well as continued multiple expansion.
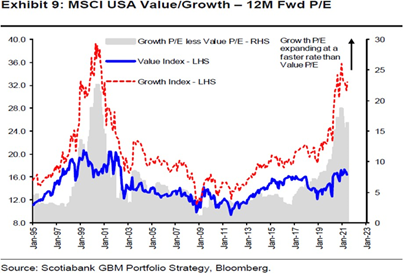
In fact, focusing on individual holdings or sectors is missing the forest for the trees, in our view. The biggest factor in a rising interest rate environment is likely to be a rotation out of highly-valued growth stocks, which have enjoyed a decade plus of outperformance and valuation expansion, and into value stocks. In our view, investors who are overweight these growth companies are making an implicit bet that the low-interest rate environment will last for the foreseeable future - especially (as can be seen from the chart below) given the valuation gap between growth and value is near the widest it has been since the dotcom bubble. While, admittedly, we’ve been waiting for Godot (in the form of a rotation to value stocks) for quite some time, we are steadfastly continuing our process of bottom-up research, finding attractively-valued investments, while always considering the potential downside first.
A New Portfolio Addition in Paradise
In early April, we initiated a position in FirstBank (FBP) [1.2% position as of 6/30/2021], the second-largest bank headquartered in Puerto Rico with a market cap of $2.6 billion. The bank offers consumer and commercial banking services in Puerto Rico. Historically, we’ve avoided investing in Puerto Rican banks given the persistent contraction of the economy since the Great Financial Crisis. However, we believe Puerto Rico is turning the corner and in process of an economic rebound.
We believe the Puerto Rican consumer will be a major beneficiary of the pandemic relief effort. To put stimulus into perspective, GDP per capita on the island is $32,000 compared to $64,000 for the United States mainland. Residents have received the same Federal stimulus checks and unemployment benefits as their mainland counterparts. Given GDP per capita is half of that on the mainland, we expect a multiplier effect which should result in a meaningful acceleration in the economy.
Additionally, post Hurricane Maria in 2017, $71 billion of relief money was allocated by Congress to Puerto Rico for reconstruction. To date, only $21 billion has been disbursed. Now under a Democratic-led D.C., relief funds are being released, with the proceeds slated for major infrastructure projects. The undistributed funds equate to approximately 66% of Puerto Rico’s annual Gross National Income (GNI). This represents a multi-year boon for the economy, both in terms of the immediate fiscal spending and long-term benefits from new infrastructure.
Also encouraging - Puerto Rico is fully open and tourism has returned per contacts on the island. The territory is also doing well on vaccinations and ahead of the mainland. Companies are hiring and wages are starting to move higher. There is also a major shortage of both high-end and affordable homes, which is leading to significant construction activity. Puerto Rico continues to attract high-net-worth individuals given major tax incentives associated with residency. There is evidence that the out-migration trend of the past 15 years is reversing and some experts expect population inflows. Finally, we are encouraged by positive traction regarding the island’s debt and fiscal restructuring.
We expect these tailwinds will result in a strong economy and positive sentiment, which should translate to loan growth and stable credit quality. While FirstBank is a beneficiary of this backdrop, the bank can also drive earnings growth internally. One initiative is through the return of excess capital. FirstBank has a common-equity-tier-one (CET1) ratio of nearly 18% as compared to mainland peers at 12%. Adjusted capital is higher after factoring in a 3.1% allowance for loan losses to gross loans (also an earnings driver as these reserves are released). Management has expressed their desire to target a CET1 ratio in-line with peers. We can make a case that FirstBank could repurchase 25%+ of shares outstanding over the next three years, while maintaining above-peer capital. The bank is well on its way with the announcement of a $300 million buyback program in April.
Last year, FirstBank used a portion of excess capital to acquire Banco Santander Puerto Rico. The deal enhances FirstBank’s franchise value, and is 35% accretive to normalized earnings with a short tangible- book-value earn-back period. We believe deal synergies can come in even better versus Street expectations. We would not be surprised at the announcement of branch closures and significant cost saves given redundancies from the combined footprint. Additionally, the deal increases FirstBank’s scale and their ability to participate in larger loan relationships. This unlocks a new segment of the commercial market, and should translate into loan growth. Management also believes there is room to further lower funding costs of the pro forma bank. Finally, the commercial franchise was enhanced with the acquisition, and the pro forma lending team has significant capacity.
The bank also has over a third of its balance sheet in the form of cash and AFS securities. Remixing into loans over time will be a boon to earnings. Additionally, if interest rates move higher, FirstBank has the optionality to reposition the securities book into higher yielding instruments. While the majority of FirstBank’s lending activity is in Puerto Rico, the bank has a small but growing presence in southern Florida. New team lift-outs or sensible merger and acquisition can accelerate the Florida growth strategy. Management also believes they are in a good position to take greater market share within Puerto Rico consumer lending and payment services from the incumbent banks.
There are multiple avenues for FirstBank to be a successful investment. Despite this, the stock remains very cheap at 1.2x price-to-tangible-book value versus nearly 2.0x for mainland peers. While FirstBank has traded at a discount to peers over the past decade, it often traded over 3x price-to-tangible-book value before the Great Financial Crisis. While we don’t believe FirstBank will return to this rich valuation any time soon, they can close the valuation gap with peers. The stock also trades at 9x 2022 estimated earnings versus the peer group at 14x. Street estimates in our opinion are conservative and we can make a case that the stock is trading at less than 7x 2023E P/E assuming the aforementioned tailwinds come to fruition. Finally, the stock has an attractive dividend yield of 2.3% and management is committed to growing the payout.
Outlook
2021 looks to be a transitional year. We are clearly in the early stages of a new economic cycle, following the coronavirus-induced recession of 2020. Continued progress on vaccinations will allow the U.S. economy to continue returning to more familiar footing with the resumption of dining out, air travel for business and pleasure, and large group gatherings. The recent United States elections, although closely contested, have ushered in a change in administration with attendant changes in the agenda around stimulus, spending, taxes, and trade. The razor-thin margins in Congress are likely to temper any radical policy shifts. Importantly the volatility emanating from the executive branch should ease.
While interest and mortgage rates have lifted, they are coming off historically low levels. We are seeing early signs of reinflation, however consensus expectations for inflation over the longer term remain relatively subdued despite the historically high levels of government spending here and around the world. We are carefully monitoring aggregate corporate debt levels (especially BBB- debt which is a single notch above junk status), currently above pre-2008 crisis levels and loom as a potential problem absent continued aggressive Fed support. Unemployment has shown significant improvement, but continues to be an issue.
In our estimation, overall equity valuations remain at elevated levels, due to the sharp rebound in equities. The high valuations of a small number of enormous technology companies certainly exert upward pressure to the overall averages. Recovery in aggregate earnings will take time as certain industries such as hospitality, entertainment, and travel are tied to the success of a vaccine rollout plan, and will take longer to return to pre-coronavirus levels. Treasury and high-grade corporate bond yields look unattractive after the dramatic flight to safety rally during 2020. In any case, value investing is ripe for a period of outperformance, and the bargains inherent in your portfolio should attract acquirers and other investors over time. Meanwhile, we still believe equities represent a superior asset allocation alternative to bonds over the longer term.
Steadfast, we remain committed to making you money while aiming to protect your wealth.
Portfolio Overview – as of 6/30/21
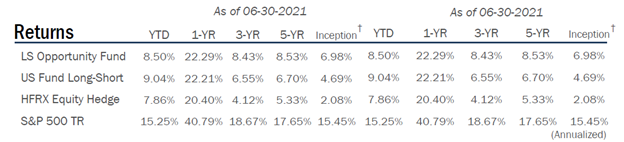
The performance data quoted represents past performance; past performance does not guarantee future results. The investment return and principal value of an investment in the Fund will fluctuate so that an investor's shares, when redeemed, may be worth more or less than their original cost. Current performance of the Fund may be lower or higher than the performance quoted. Performance data current to the most recent month end may be obtained by calling 1.877.338.8783. The Gross Expense Ratio is 2.99%. ††
†Annualized returns since inception date of the Fund, 09/29/2010.
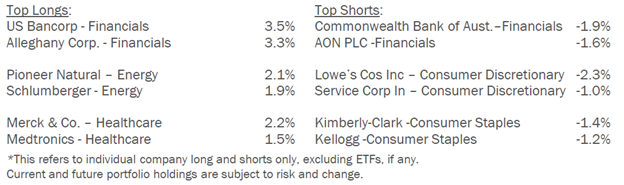
Top Holdings By Sector – as of 6/30/21
Risk Characteristics – as of 6/30/21
Disclosures:
You should carefully consider the investment objectives, potential risks, management fees, and charges and expenses of the Fund before investing. The Fund’s prospectus contains this and other information about the Fund and should be read carefully before investing. You may obtain a current copy of the Fund’s prospectus by calling 1.877.336.6763.
The Fund is distributed by Ultimus Fund Distributors, LLC. (Member FINRA) There is no affiliation between Ultimus Fund Distributors, LLC. and the other firms mentioned in this material.
Investment in shares of a long/short equity fund has the potential for significant risk and volatility. A short equity strategy can diminish returns in a rising market as well as having the potential of presenting unlimited losses. These types of funds typically have a high portfolio turnover that could increase transaction costs and cause short-short-term capital gains to be realized.
The Fund may lose money due to fluctuations within the stock market which may be unrelated to individual issuers and could not have been predicted. The price of the securities which the Fund holds may change unpredictably and due to local, regional, international, or global events. These events may include economic downturns such as recessions or depressions; natural occurrences such as natural disasters, epidemics, or pandemics; acts of violence such as terrorism or war; and political and social unrest. Due to the prominence of globalization and global trade, the securities held by the Fund may be affected by international and global events. In the case of a general market downturn, multiple asset classes, or the entire market, may be negatively affected for an extended and unknown amount of time. Although all securities are subject to these risk, different securities will be affected in different manners depending on the event.
†† The Adviser has contractually agreed to waive or limit its fees and to assume other expenses of the Fund until September 30, 2021 so that the ratio of total annual operating expenses (not including interest, taxes, brokerage commissions, other expenditures which are capitalized in accordance with generally accepted accounting principles, other extraordinary expenses not incurred in the ordinary course of business, dividend expenses on short sales, expenses incurred under a Rule 12b-1 plan, acquired fund fees and expenses and expenses that the Fund incurred but did not actually pay because of an expense offset arrangement) does not exceed 1.95%.
Prospector Partners, LLC assumed investment management duties on 05-28-2015 and was formally approved by shareholders on 09-17-2015.
Effective November 30, 2020, the Morningstar US Long Short Fund Index replaced the HFRX Equity Hedge Index as the Fund's performance benchmark because the Morningstar US Long Short Fund more closely aligns with the Fund's investment strategy and portfolio composition.
Risk Statistic Definitions:
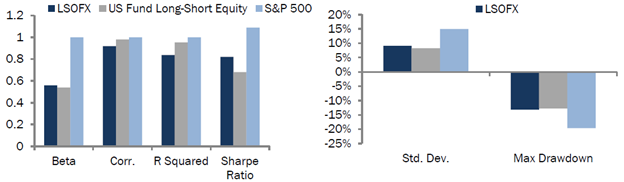
Standard Deviation measures the volatility of the Fund’s returns. Beta measures the Fund’s sensitivity to market movements. Sharpe Ratio uses the Fund’s standard deviation and average excess return over the risk-free rate to determine reward per unit of risk. R-squared represents the percentage of the portfolio’s movements that can be explained by general market movements. Upside/Downside Capture Ratio measures a manager’s ability to generate an excess return above the benchmark return in up markets and retain more of the excess return in down markets. Risk statistics are relative to the S&P 500. Batting Average is a statistical measure used to evaluate an investment manager’s ability to meet or beat their index. Omega is a relative measure of the likelihood of achieving a given return. Max Drawdown is the peak-to-trough decline during a specific recorded period of an investment. Gross Exposure is the sum of the absolute values of the fund’s long and short exposures.
Morningstar US Long Short Fund Category – Long-short portfolios hold sizable stakes in both long and short positions. Some funds that fall into this category are market neutral – dividing their exposure equally between long and short positions in an attempt to earn a modest return that is not tied to the market’s fortunes. Other positions that are not market neutral will shift their exposure to long and short positions depending upon their macro outlook or the opportunities they uncover through bottom-up research.
HFRX Equity Hedge Index - Equity Hedge strategies maintain positions both long and short in primarily equity and equity derivative securities. A wide variety of investment processes can be employed to arrive at an investment decision, including both quantitative and fundamental techniques; strategies can be broadly diversified or narrowly focused on specific sectors and can range broadly in terms of levels of net exposure, leverage employed, holding period, concentrations of market capitalizations and valuation ranges of typical portfolios. Equity Hedge managers would typically maintain at least 50%, and may in some cases be substantially entirely invested in equities, both long and short.
13222007-UFD-7/22/2021