The benchmark S&P 500 continued its charge higher during the third quarter, despite significant increases in COVID-19 cases and certain states such as Florida, Texas, Arizona and California seeing major outbreaks. The market remained focused on the reopening of the economy and improving jobs numbers as the unemployment rate fell to 7.9% by September, down from the April peak of 14.7%.
Additionally, while the increase in coronavirus cases was concerning, it’s become more evident that the medical community is finding better treatment protocols for the virus, as hospitalization and death rates are much improved versus the spring. Continuing a trend, growth stocks again significantly outperformed their value brethren – with a year to date performance gap of 32% between the S&P 500 Growth and Value indices. While we don’t know whether we are nearing a top of the growth/value trade, we are seeing more and more behavior reminiscent of the “dotcom bubble.” For example, the mere announcement of stock splits caused Apple and Tesla shares to rocket higher, with Apple adding roughly $700 billion of market value over the course of a month following the announcement (equal to the total market value of the bottom 100 companies in the S&P 500) and Tesla stock increasing over 75% from their announcement to the date of the stock split.
What could cause a rotation from growth to value stocks in the relative near term? Typically, the start of a new economic cycle acts as a catalyst for value stock outperformance relative to growth. Additionally, increased expectations for inflation and rising interest rates could spark a value outperformance. Also, we are confident a vaccine for COVID-19 will be approved within the next six months. There are currently 38 vaccine candidates in clinical evaluation and 149 in pre-clinical evaluation. A handful of promising candidates are currently in late-stage phase 3 trials. As a vaccine becomes available and distributed, we would expect an economic recovery to accelerate.
As to inflation expectations, the current yield curve seems to suggest a prevailing view that, similar to the period following the Great Financial Crisis (GFC), the forthcoming recovery will see a period heavily influenced by deflationary forces. We believe a strong case could be made that this recovery will be different. The fiscal and monetary responses to this crisis were of unprecedented size and enacted much more swiftly than during the GFC. Additionally, the fiscal response (CARES Act, and Paycheck Protection Program) was more directly targeted at consumers (versus bailing out financial institutions), and thus the U.S. consumer has shown more resilience than a decade ago. Indeed, U.S. retail sales have already rebounded above pre-pandemic levels, whereas it took 32 months for retail sales to achieve the same following the 2008-2009 crisis. Bank balance sheets are also in much better shape and these institutions are more willing/able to lend than they were following the GFC.
Given this crisis was not the result of an over-levered system, we should not see the same pullback in willingness to lend as we come out of the crisis. Finally, Fed chairman Jerome Powell recently announced a major policy shift whereby the central bank indicated they will allow inflation to run higher than their 2% target for some period of time. All of these factors lead us to believe that expectations for inflation are likely to rise, as will the long end of the yield curve. Meanwhile, we expect the Fed to maintain their low short-term rate posture, which could result in a steeper yield curve. This environment would be positive for financial services stocks, and banks specifically.
Warming Up to Banks
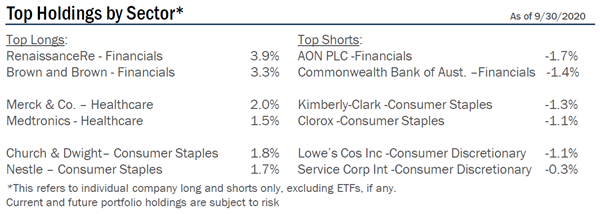
In the first quarter letter, we explained our reasoning for reducing the portfolio’s overall exposure to banks given COVID-19 related uncertainties. Despite unknowns, we retained a small level of net exposure to banks given robust capital levels, conservative balance sheets, and improved oversight since the Great Financial Crisis. We also viewed (and still view) banks as part of the COVID solution, evidenced by facilitation of the PPP program, and not as a root of the problem as in the last crisis. That said, we’ve begun to increase net exposure to banks in the third quarter given improving clarity on loan losses, reserve levels, the potential for cost saves, and capital management.
As this crisis intensified, in an effort to help borrowers, banks granted loan payment deferrals to those impacted by COVID. Regulators allowed banks to grant deferrals without classifying the loan as non-performing or a troubled debt restructuring in 2020. Banks took full advantage of this policy and granted deferrals to practically any borrower who wanted one – deferrals for U.S. banks over $50 billion in assets totaled $352 billion or nearly 7% of loans on average (with some banks deferring 20-30% of their loan portfolio). Two types of borrowers took advantage of first round deferrals – the first being borrowers severely impacted by COVID who needed relief; the second group being borrowers who took deferrals as a precautionary measure in case the environment deteriorated further.
Today, the majority of first-round deferrals have expired and banks are only granting second-round deferrals to customers still facing significant challenges. Thus, we view second-round deferrals as a good proxy for future non-performing asset formation. To our surprise, Q3 deferral updates improved better than expectations, with a low level of requests for additional deferrals. This is exemplified by our investment in Comerica Bank (CMA), which reported that only 1.2% of loans were on deferral, down from over 8% at the peak. Additionally, only 0.6% of current deferrals consist of second-round deferrals which is extremely low, especially with a robust loss reserve of 2.2% of loans. Given the strong improvement in deferrals, coupled with strong reserves, we were compelled to initiate a position in CMA during the quarter at prices well below tangible book value.
We also now have greater clarity surrounding loan loss reserves. Going into the quarter, analysts were calling for the large loss provisions taken in Q1 and Q2 to continue into the future. This would place pressure on bank earnings, lower capital levels, and compromise the ability to pay dividends. However, management teams believe the bulk of provisioning is complete and will meaningfully decelerate in Q3 and beyond. Jamie Dimon, from the bellwether JPMorgan Chase (JPM) stated the bank is properly reserved for losses far beyond their base case – a key reason why we are attracted to the stock, and maintain a position in the portfolio - in addition to its management team, franchise value, conservative underwriting, and best-in-class digital capabilities. The reason why banks have aggressively built loss reserves early this cycle is largely due to recent implementation of the Current Expected Credit Loss model (CECL). Prior to CECL, banks set aside capital for losses as they became apparent. Under CECL, banks are now required to reserve for expected losses on the day the loan is approved. CECL is also a dynamic model, meaning that as the economic outlook deteriorates, banks must set aside more capital for reserves – the opposite is true if the outlook improves. As the outlook deteriorated in March / April, banks were forced to drastically increase reserves to prepare for losses. Given the current and improved outlook, banks are cautiously optimistic they are well reserved for future losses under CECL.
One positive development as a result of COVID, is that banks expect material cost save opportunities. Given public health concerns, many customers are shunning in-person branch visits and adopting digital banking. Management teams believe this crisis has sped up the digital banking adoption process by multiple years. As a result, banks expect to accelerate the number of branch closures, which will drive cost saves. In the portfolio, PNC Financial Services (PNC) announced their intention to nearly double the number of branch closures in 2020 to 160 branches, which represents 7% of total branches. Next year, PNC expects branch closures to be 40%+ above pre-COVID levels given the success of its digital banking strategy. Additionally, PNC’s expansion into new markets will be via a digital strategy that is branch-lite and more efficient. These cost saves partially offset the earnings headwind borne by a low interest rate environment (as low rates equate to pressure on net interest margins).
Another way we expect banks to capitalize on cost saves and enhance digital capabilities is via consolidation. While we continue to expect muted M&A activity for the remainder of 2020, we are expecting a rebound in 2021. By this time, we should have even more clarity regarding credit quality and the economy…which should facilitate deal making. Additionally, management teams we’ve spoken with expect merger activity to return in 2021 given the need for banks to achieve economies of scale in a post-COVID world and to expand digital banking capabilities. To illustrate the long-term industry consolidation thesis (and the potential for returns given acquisition premiums and economies of scale), there are ~4,300 banks in the United States as compared to nearly 7,000 ten years ago, with ~850 being publicly traded. This compares to 88 banks in Canada, only 11 of them publicly traded. In Australia, there are 39 banks, only 9 of them publicly traded. Clearly, there are too many independent banks in the USA, especially given the rise of digital banking and de-emphasis of branch banking. Some experts believe the impact of COVID on the industry will even accelerate consolidation activity beyond pre-COVID levels.
PNC is one bank that has a strong desire to engage in M&A given a durable balance sheet and significant excess capital post divestment of their stake in the asset manager Blackrock in Q2. We believe two banks in the portfolio, KeyCorp (KEY) and Comerica (CMA), make particularly attractive acquisition targets for PNC. Both of these banks are prime candidates given their commercial banking focus, excellent core deposit base, and geographic presence outside of PNC’s footprint – criteria PNC desires. Per our proprietary merger model, PNC can pay a 30%+ purchase price premium for KEY and achieve double-digit EPS accretion while keeping tangible book value earn-back under three years. This transaction would be highly attractive for PNC and KEY shareholders (i.e. you “win” as shareholders on both sides of the transaction). A merger with CMA would yield attractive results as well.
Despite positive developments, the bank sector is trading at bottom decile valuations on price relative to tangible book value and provide an attractive dividend yield of 3.4% at September 30 (with multiple banks in the portfolio yielding 6%+). This is partially understandable given ultra-low interest rates, uncertainty regarding credit quality, and a benign loan growth outlook. However, given the improving outlook for credit quality, loss reserves, cost saves, and M&A – we believe these positives are being overlooked by traditional investors. Bank stock multiples should begin to re-rate with increased clarity on the election, economy, and credit in the coming months. We also expect loan growth to pick up in 2021 assuming the recovery continues and loan pre-payment activity naturally subsides. While interest rates are out of the control of banks, we believe the market is not reflecting the possibility of higher interest rates in coming years. As stated earlier, there is a chance that unprecedented fiscal and monetary stimulus will lead to higher inflation and as a result higher interest rates. A number of Fed officials have stated their willingness to hike rates before 2023 assuming inflation picks up. Such a scenario will be a major tailwind for the bank sector, and in contrast to the consensus view. In the interim, we expect mortgage banking fees to remain elevated given the low-rate environment which is a partial offset. On the topic of fees, we also expect banks to raise service charges in the near-future, which would be helpful to earnings (service fees were waived in Q1 / Q2 to support customers). Finally, we expect robust investment banking fees to persist given market volatility.
A re-rating of the sector can also accelerate should banks resume share repurchases. This supports the sector from additional buying interest, and as a vote of confidence. Green shoots can be seen as overcapitalized institutions such as Atlantic Capital Bank (ACBI), HarborOne Bank (HONE), and Waterstone Financial (WSBF) announced buyback programs in Q3 with support from regulators. Larger banks such as JPMorgan Chase stated their willingness to resume share repurchases as soon as Q4, or early 2021 given strong capital generation. The resurgence of M&A activity is another re-rating catalyst for banks going forward, and we are hopeful deal making will resume in the first half of 2021.
We will continue to closely monitor the bank landscape and be ready to add exposure if positive developments continue to unfold; especially with the sector trading at a multi-decade valuation low.
Outlook
The range of outcomes in the short to intermediate term is wide and hinges on the imminent outcome of the “bending the curve” effort to curtail the COVID-19 pandemic. Economic contraction, trade and geopolitical concerns weigh heavily. The upcoming United States presidential election is right around the corner and the outcome could prolong market volatility.
Interest and mortgage rates continue near historically low levels, inflation is currently non-existent, and we have experienced a recession. We are carefully monitoring aggregate corporate debt levels (especially BBB- debt which is a single notch above junk status), which now sit above pre-2008 crisis levels and loom as a potential problem absent aggressive Fed buying through the latest quantitative easing strategy. Unemployment has shown improvement, but continues to be in the high-single digits.
In our estimation, equity valuations remain at elevated levels, due to the sharp decline in expected earnings for the rest of 2020 and into 2021, and the sharp rebound in equities. Recovery in aggregate earnings will be slow as certain industries such as hospitality, entertainment, and travel will take longer to return to pre-coronavirus levels. Treasury and high-grade corporate bond yields look unattractive after the dramatic flight to safety rally during the current health crisis. In any case, the values inherent in the portfolio should attract acquirers and other investors over time. Meanwhile, we still believe equities are a superior asset allocation alternative to bonds over the longer term.
Steadfast, we remain committed to making you money while aiming to protect your wealth.
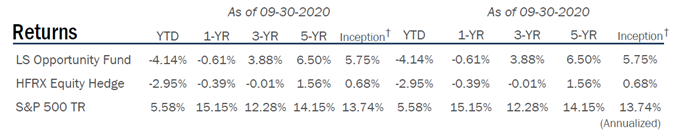
The performance data quoted represents past performance; past performance does not guarantee future results. The investment return and principal value of an investment in the Fund will fluctuate so that an investor’s shares, when redeemed, may be worth more or less than their original cost. Current performance of the Fund may be lower or higher than the performance quoted. Performance data current to the most recent month end may be obtained by calling 1.877.338.8783. The Gross Expense Ratio is 3.13%. The Net Expense Ratio is 2.91%. † Annualized returns since inception date of the Fund, 09/29/2010.
Disclosures
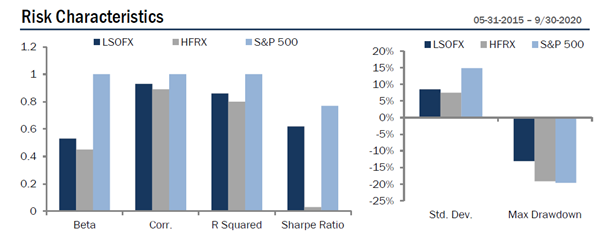
Risk Statistic Definitions: Standard Deviation measures the volatility of the Fund’s returns. Beta measures the Fund’s sensitivity to market movements. Sharpe Ratio uses the Fund’s standard deviation and average excess return over the risk-free rate to determine reward per unit of risk. R-squared represents the percentage of the portfolio’s movements that can be explained by general market movements. Upside/Downside Capture Ratio measures a manager’s ability to generate an excess return above the benchmark return in up markets and retain more of the excess return in down markets. Risk statistics are relative to the HFRX. Batting Average is a statistical measure used to evaluate an investment manager’s ability to meet or beat their index. Traynor Ratio measures excess returns per each unit of market risk, as measured by beta. Omega is a relative measure of the likelihood of achieving a given return. Max Drawdown is the peak-to-trough decline during a specific recorded period of an investment. Gross Exposure is the sum of the absolute values of the fund’s long and short exposures. Net Exposure is the fund’s total long exposure less the fund’s total short exposure. The Gross Expense Ratio is 3.13%. The Net Expense Ratio is 2.91%.The Expense Cap is 1.95%. The Adviser has contractually agreed to waive or limit its fees to 1.95%
Prospector Partners, LLC assumed investment management duties on 05-28-2015 and was formally approved by shareholders on 09-17-2015.
The Expense Cap is 1.95%. The Adviser has contractually agreed to waive or limit its fees to 1.95% and to assume other expenses of the Fund until September 30, 2021, so that the ratio of total annual operating expenses (not including interest, taxes, brokerage commissions, other expenditures which are capitalized in accordance with generally accepted accounting principles, other extraordinary expenses not incurred in the ordinary course of business, dividend expenses on short sales, expenses incurred under a Rule 12b-1 plan, acquired fund fees and expenses and expenses that the Fund incurred but did not actually pay because of an expense offset arrangement) does not exceed 1.95%.
Investment in shares of a long/short equity fund has the potential for significant risk and volatility. A short equity strategy can diminish returns in a rising market as well as having the potential for unlimited losses. These types of funds typically have a high portfolio turnover that could increase transaction costs and cause short-term capital gains to be realized.
You should carefully consider the investment objectives, potential risks, management fees, and charges and expenses of the Fund before investing. The Fund’s prospectus contains this and other information about the Fund, and should be read carefully before investing. You may obtain a current copy of the Fund’s prospectus by calling 1.877.336.6763. The Fund is distributed by Ultimus Fund Distributors, LLC. (Member FINRA).
11208087-UFD-10/14/2020