Insights from Long Short Advisors
Current Market Environment
We entered 2023 in the midst of very restrictive monetary policy, a deeply inverted yield curve, significantly higher interest rates and the continued drying up of consumers' post-pandemic excess savings. A Wall Street Journal survey of economists pegged the chances of a recession at 63% heading into the year. This foreboding backdrop was followed in March by the largest bank failures on record… Not the greatest setup for a bull market.
What would follow is one of the more bifurcated markets in memory – with technology stocks dominating virtually everything else. More specifically, a handful of mega-cap tech stocks, now known as the "Magnificent 7" captured headlines (and asset flows) much of the year, stemming from excitement over the prospects for artificial intelligence. These names, (which include: Microsoft, Amazon.com, Meta Platforms, Apple, Alphabet, Nvidia, and Tesla) gained an average of 105% for the year, with Apple being the laggard – up 49%. They alone contributed over 16 percentage points of the S&P 500's 26.3% return for the year. Notably, the strength and size of these stocks masked investor unease elsewhere regarding the prospects for inflation and the economy. Indeed, the equal-weighted S&P 500 had produced a negative return through the end of October as 10-year Treasury yields peaked over 5%, fueling fears of a Fed-induced recession.
However, sentiment sharply reversed in November, when the Consumer Price Index (CPI) came in below expectations, seemingly putting an elusive “soft landing” for the U.S. economy into view. This kicked off a stock market rally, which only picked up steam in December, following what most thought was a dovish Federal Reserve meeting. Bonds rallied on expectations of an end to the Fed’s hiking cycle, and the decline in interest rates helped fuel what some have called a "dash for trash" rally, where the most levered and speculative stocks led the market. Unsurprisingly, given your portfolio’s quality bias, the Fund participated in a portion of the year-end rally, but trailed on a relative basis.
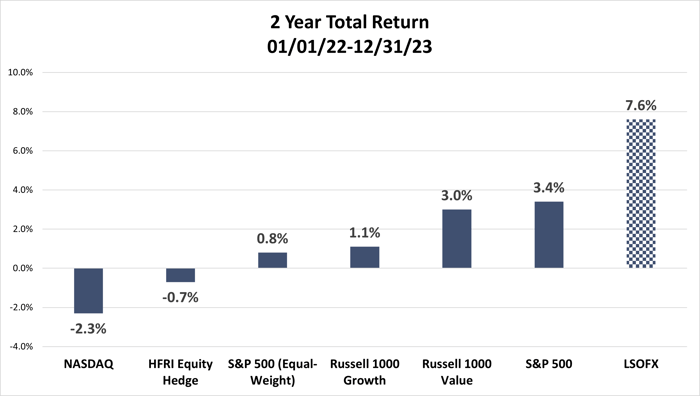
Despite the dramatic uplift in November and December, and the remarkable tech-stock rally during the year (which saw the NASDAQ return 45%, and Russell 1000 Growth Index gain 43%, outpacing its Value counterpart by over 31%), one could be forgiven had they awakened from a Rip Van Winkle-like two-year slumber, only to think not much had happened during their sleep. After all, while 2022 and 2023 both felt like wild rides at times, and had their share of volatility, cumulative returns for the aforementioned indices have been fairly unremarkable over the period (as seen in the chart below). We have also included LSOFX’s net return for the period. We view investing as a marathon, not a sprint…over longer periods, quality companies that produce solid cash flows can often produce favorable returns.
The performance data quoted represents past performance; past performance does not guarantee future results. As of 12/31/2023, the Fund’s 1-YR return was 11.00%. The Fund returned 6.55%, 8.09%, 5.32% for the 3, 5, 10-year periods, respectively and 6.50% since inception. The investment return and principal value of an investment in the Fund will fluctuate so that an investor's shares, when redeemed, may be worth more or less than their original cost. Current performance of the Fund may be lower or higher than the performance quoted. Performance data current to the most recent month end may be obtained by calling 1.877.336.6763. The Gross Expense Ratio is 3.05%. The Net Expense Ratio is 3.00%.
Financial Services Update
The reemergence of inflation in recent years has had a significant impact on the insurance industry. Claims inflation from natural catastrophes, labor, repair costs and supplies, as well as legal settlements, has created a need for property-casualty (P-C) insurers to both increase their carried reserves for previously accrued claims as well as increase expected expenses for claims yet to occur. The companies have been raising prices now for years to get ahead of this significant change in loss trend. We have meaningful investments in companies who, in our view, have the ability to reserve accordingly and price at necessary levels to improve margins and returns. Insurance brokers (middle-men) have also benefited meaningfully from these price increases, as their commissions and fees have accelerated somewhat consistently with the higher premiums paid by their customers.
This new era of higher absolute interest rates has also had a meaningful impact on property-casualty investment portfolios. Insurers’ portfolios do not turnover 100% every year, but in general, property- casualty insurers’ portfolio durations tend to be about 3-4, and the benefit of investing today’s collected premiums at yields well in excess of existing portfolio yields will accrue for years to come. Insurance brokers have also benefited from the higher short-term yields attained on the “float” they manage (premiums collected from customers and remitted to insurance carriers).
Life insurance companies’ investment portfolios turn over even less rapidly than property-casualty insurers’, but the benefit does accrue to their financials as well (over a longer period of time). However, we have meaningful investments in companies whose cash generation and portfolio turnover compares favorably to others in the sector. Additionally, these companies have benefited from a meaningful normalization of mortality post the worst days of the pandemic.
We are pleased with how our investments in both P-C and Life insurers have performed with the aforementioned tailwinds. However, we are constantly reassessing the attractiveness of these investments versus other opportunities we find, and we have reduced our exposure in certain areas of insurance where pricing is no longer in excess of loss inflation and/or where valuations no longer appear to have room to expand. As always, we diligently strive to more heavily weight the portfolio in the opportunities where we see the greatest asymmetry of returns and it is through this lens that reductions in insurance will be made.
During the second half of 2023 we added bank exposure, which aided your participation in the Q4 bank rally. We initiated a new position in Ameris Bancorp as we had the opportunity to purchase a premier southeast banking franchise at an attractive valuation. We also added to our existing positions in PNC Financial Services and Citigroup, initiated a long position in Goldman Sachs and covered our short position in Truist Financial. While we materially increased our weighting to banks over the second half of the year (from what was a net short position at the end of Q2), Prospector remains underweight the sector relative to history.
At this point, banks have realized the majority of expected net interest margin compression. While this substantial overhang has been absorbed, there are other potential headwinds which keep us from getting significantly more bullish. The late 2023 bank rally was predicated on market optimism for a soft landing and rate cuts. This is well reflected in Street estimates for credit losses which are optimistic in nature as loss reserves remain materially below historical averages. A slowdown in the economy could result in a 15% to 25%+ reduction in forward EPS from higher loss provisioning. Other headwinds include: a modest loan growth outlook, rising capital levels, increasing regulatory costs, limited capital return, a weak M&A backdrop, non-bank market share gains and continued cost headwinds from inflation. We maintain a robust watchlist of potential ideas and patiently await a better entry point on fundamentals and valuations before we decide to more meaningfully increase exposure. In the interim, we remain optimistic that our bank long / short book will continue to aid overall performance. To that extent, recent sector outperformance has given us the opportunity to establish new short positions in banks that have poorly positioned balance sheets and greater credit risk versus consensus thinking.
Outlook
Since early 2022, the Federal Reserve has aggressively raised interest rates in an effort to lower inflation, causing significant uncertainty within stock and bond markets. While the rate of inflation has subsided, and the consensus appears to be we have reached an end to the Fed hiking cycle, declaring victory would be premature. The U.S. and rest of the world continue to manage the impacts of inflation, higher interest rates, and geopolitical events. In our assessment, there remains a possibility of Federal Reserve policy error and / or recession, though barring extraneous events, we still lean towards slowdown and not recession per se.
The biggest risk right now would seem to be from a “shock to the system” during this period of relative weakness while we are transitioning from the pandemic economy to a more normalized economy. Certainly, the traumatic events in Israel, and the risk of potential systemic shock that might spread from the Middle East in the months to come, keep us up at night as we are sure they do you as well. As always, with our bias towards quality, we strive to mitigate any downside, while also participating in the. upside.
Meanwhile, employment remains strong. Heavy fiscal stimulus from already passed U.S. legislation for defense, infrastructure, semiconductors, and energy investment are only now beginning to be awarded. The spending will not peak until later in the decade. Relatively high energy costs in Europe, and Germany in particular, makes manufacturing here relatively more attractive. Political risk in China makes that country less attractive to do business in. All told, U.S. manufacturing is being called upon to step up. Barring a major crisis, Ronald Reagan’s termed “willing workers” should be able to find jobs…and pay their bills. Furthermore, supply / demand imbalances in the labor market suggest further wage gains to come which will partially mitigate the impact of inflation on the consumer. We expect continued pressure on housing prices as a result of higher interest rates and affordability concerns. However, the shortage of housing after over a decade of underinvestment following the Great Financial Crisis should prevent a disastrous decline in home prices. Lower-income consumers have been most impacted by the current inflationary environment, but consumer balance sheets remain generally healthy for the majority of Americans, and consumer credit quality remains strong at the moment.
While what we see argues for a more inflationary and higher interest rate environment than seen in the past ten years, it also does not argue for a recession. Nonetheless, the unexpected can occur. Should a recession happen in the near term, the factors highlighted above suggest it could be less significant than the previous two recessionary periods. We are also mindful that 2024 is an election year, the result of which could have implications on companies, sectors and the overall economy. Following years of lower interest rates helping to drive ever-higher growth-stock valuations, we feel value investing is ripe for a period of outperformance. We continue to find opportunities to invest in quality businesses with solid balance sheets and cash flows, whose share prices have detached from our assessment of the fundamentals. The bargains inherent in your portfolio should attract acquirers and other investors over time.
Steadfast, we remain committed to making you money while aiming to protect your wealth.
-The LS Opportunity Fund Portfolio Management Team
Disclosures:
The S&P 500 Index is a widely recognized, unmanaged index of equity prices and is representative of a broader market and range of securities than is found in the Fund’s portfolio. The NASDAQ Composite Index is a broad-based capitalization-weighted index of stocks in all three NASDAQ tiers: Global Select, Global Market and Capital Market. The S&P 500 Equal Weighted Index (EWI) is the equal-weight version of the widely-used S&P500. The index includes the same constituents as the capitalization weighted S&P 500, but each company in the S&P 500 EWI is allocated a fixed weight – or 0.2% of the index total at each quarterly rebalance. The Russell 1000 Growth Index measures the performance of those Russell 1000 companies with higher price-to-book ratios and higher forecasted growth values. The Russell 1000 Value Index measures the performance of those Russell 1000 companies with lower price-to-book ratios and lower forecasted growth values. HFRI - Equity Hedge (Total) Index is a fund weighted index of investment managers that maintain positions both long and short in primarily equity and equity derivative securities. All index returns include the effect of reinvested dividends. The Index is an unmanaged benchmark that assumes reinvestment of all distributions and excludes the effect of taxes and fees. Individuals cannot invest directly in this Index; however, an individual can invest in exchange traded funds or other investment vehicles that attempt to track the performance of a benchmark index
The Morningstar Rating™ for funds, or "star rating", is calculated for managed products (including mutual funds, variable annuity and variable life subaccounts, exchange-traded funds, closed-end funds, and separate accounts) with at least a three-year history. Exchange-traded funds and open-ended mutual funds are considered a single population for comparative purposes. It is calculated based on a Morningstar Risk-Adjusted Return measure that accounts for variation in a managed product's monthly excess performance, placing more emphasis on downward variations and rewarding consistent performance. The Morningstar Rating does not include any adjustment for sales loads. The top 10% of products in each product category receive 5 stars, the next 22.5% receive 4 stars, the next 35% receive 3 stars, the next 22.5% receive 2 stars, and the bottom 10% receive 1 star. The Overall Morningstar Rating for a managed product is derived from a weighted average of the performance figures associated with its three-, five-, and 10-year (if applicable) Morningstar Rating metrics. The weights are: 100% three-year rating for 36-59 months of total returns, 60% five-year rating/40% three-year rating for 60-119 months of total returns, and 50% 10-year rating/30% five-year rating/20% three-year rating for 120 or more months of total returns. While the 10-year overall star rating formula seems to give the most weight to the 10- year period, the most recent three-year period actually has the greatest impact because it is included in all three rating periods. cross the US Long Short Equity category, as of 12/31/2023, LSOFX received the following Morningstar Rating™ for the 3-year, 5-year, 10-year periods, respectively: 4 stars out of 154 funds, 4 stars out of 136 funds, and 4 stars out of 72 funds.
17834561-UFD 01/31/2024