Current Market Environment
The first quarter of 2024 was marked by a continued pushing out of expectations for when, and by how much, the Federal Reserve would cut rates, as inflation remained above the Fed’s 2% target and the U.S. economy remained resilient. January's release of December's CPI (Consumer Price Index) came in at 3.4% against a 3.2% estimate, with core inflation still running at 3.9%. Later in the month, 4Q23 GDP was also reported significantly ahead of expectations - coming in at 3.3% versus the 2.0% growth expected. Adding to the “higher for longer” narrative, CPI readings in February and March would also come in above consensus expectations.
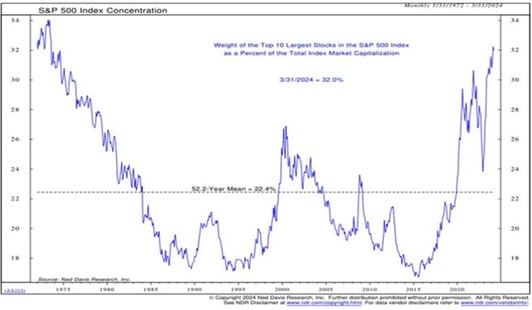
Given the stock market's ebullient response late in 2023 to perceived dovish inflation readings and Federal Reserve statements, it would have been reasonable to expect stocks to reverse course on more hawkish data. However, in this seemingly "all news is good news" market environment, the opposite proved true in the first quarter. Indeed, the S&P 500 gained over 10% with all sectors, save for real estate, rising. While market breadth improved during the first quarter, given the S&P 500 concentration, four stocks (Nvidia, Microsoft, Meta Platforms, and Amazon) contributed roughly half of the S&P 500 return for the period. As can be seen in the chart below, the Index's concentration has continued to grow and has not been this top-heavy since the 1970s.
Although we were unsurprised by the more tempered estimates for Fed rate cuts in 2024, given forecasts for as many as six or seven rate cuts during the year seemed overly aggressive, the market's continued strength against this more hawkish backdrop has been remarkable. With the job market remaining strong, unemployment below 4%, and economic growth resilient, we continue to think it is too early to declare victory on the inflation front. Additionally, the recent unsettling rise in commodities has garnered investor attention during the first weeks of April.
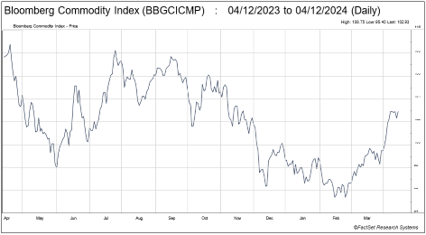
By way of example, year to date through April 12, copper is up 9%, silver up 18%, WTI crude oil 20%, and cocoa up an astounding 150%. These increases, buoyed by increasing estimates for global growth, geopolitical tensions and, in cocoa's case, years of under planting and diseased crops, risk finding their way into further goods inflation. To date, the U.S. consumer has been incredibly resilient in the face of persistent inflation and rising interest rates. However, as we get farther removed from pandemic-related fiscal stimulus, and as the consumer continues to grapple with higher interest rates, should inflation persist at higher levels, it could have a considerably negative impact on consumer confidence and spending.
Given the late 2023 rally, and strong start to 2024, it is unsurprising that our bottom-up investment analysis provided more short selling, and put-buying opportunities than long ideas during the first quarter. As a result of this, as well as some trimming of long positions, the Fund’s (non-options adjusted) net exposure was reduced from 66% at the beginning of the year to just under 60% at March 31. In our view, the market has priced in a near “Goldilocks” scenario of continued economic growth, tamed inflation, and the beginning of a Fed rate cut cycle. Against this backdrop, we are content with the somewhat reduced exposure at quarter’s end.
Electric Vehicle Collateral Damage
It is important to note that despite a fairly broad-based rally year to date, the market is not a monolith – we continue to find opportunities to buy attractively valued companies which have not fully participated in the rally. For example, recent expectations for electric vehicle (EV) demand and production has been reduced due to a combination of factors including concerns over battery life and insufficient charging infrastructure, as well as overall affordability. The negativity surrounding EV’s resulted in Tesla (TSLA) being the overall biggest decliner in the S&P 500 during the first quarter, dropping over 29% for the period.
While the portfolio does not have a position in TSLA, and we have generally viewed expectations for EV share gains to be overly aggressive, the Fund is long a number of positions with exposure to long-term secular growth from electrification and automation (first discussed in our 4Q21 letter). Objectively, we are in a time where more and more functions in our daily lives are being automated. Whether it be driver assist in our cars, ordering food at restaurants, or line assembly in a manufacturing plant, demand for technology enabling this automation is increasing. Likewise, the increased use of electricity as a power source will likely drive the need for electrical grid upgrades for years, or decades to come.
Some of the current positions with exposure to these trends include: Eaton Corp., Trimble, Littelfuse, and Zebra Technologies. In addition to the aforementioned holdings, we took advantage of the negative sentiment surrounding EV’s during the first quarter by initiating a long position in Aptiv, PLC (APTV). Aptiv, a high-quality company that has been on our radar for years, is a leader in supplying auto OEMs (original equipment manufacturers) software and hardware enabling automated driving, advanced safety features (e.g., driver lane assist, blind-spot warning), as well as products related to the entire EV architecture…from chargers to power distribution boxes to high-voltage connectors. Given the negativity surrounding Aptiv’s end markets, the stock has been weak – down over 50% from its 2021 highs. We feel we were able to initiate the APTV position at an attractive free-cash flow yield. As sentiment improves, investors should focus on the long-term secular growth story, providing an opportunity for the stock to re-rate higher.
Reduced Restaurant Appetite
During the first quarter we reduced our exposure to the restaurant sector. We believe the combination of weak top line growth, ongoing cost inflation, and weakening pricing power creates a difficult backdrop for near-term restaurant fundamentals.
The main drivers of revenue growth for a typical restaurant are: 1) organic same-store sales growth, 2) new unit growth, and 3) M&A (i.e. acquiring competitors). Of those, many consider same-store-sales growth (guest count growth + growth in average ticket per guest) as the key indicator of a brand’s underlying health. In recent quarters, the primary driver of same-store sales growth for the industry has been elevated levels of average ticket growth (pricing), while guest count growth (volume) has been muted or negative. This pricing dynamic was fueled by restaurants working to offset outsized increases in labor and commodity costs, along with guests splurging on extra drinks and appetizers following a period of COVID-driven pent up demand. Given the pent up demand, improved consumer balance sheets exiting COVID, and the broad nature of inflation across the economy, these pricing actions were generally tolerated by consumers.
In addition to driving sales growth, the ability to increase prices is critical to maintaining profit margins amidst elevated labor costs and increased food/ingredient costs. While those inflationary pressures have eased off their peaks, restaurants are not out of the woods yet. On the hiring front, labor shortages have eased but competent workers are still in demand. In the broader U.S. economy, wage growth has moderated but remains elevated. And for restaurants with exposure to California, they’ll have to deal with the additional headwind of new legislation that pushes the state’s minimum wage for fast food workers to $20/hour. On the food procurement side of the business, many items of the shopping basket are lower year-over-year but some of that relief has reversed following recent month-over-month increases. It’s also worth noting that menu composition and commodity exposures vary by restaurant. For example, those who primarily serve beef continue to experience elevated costs and the prospect of relief remains uncertain.
While 2023 saw the American consumer’s resilience on full display, their appetite for continued price increases is showing signs of moderation. In communications with investors on recent earnings calls and at recent conferences, management teams have flagged softness in demand from the lower income consumer demographic. Lamb Weston, supplier to many large fast food chains, sees french fry demand “at or below” the category’s historical growth rate. McDonald’s, one of their largest customers, sees a challenging consumer environment in which customers are seeking affordable options after years of cumulative inflation across their personal budgets. Who can blame them? According to Restaurantbusinessonline.com, the price of a cheeseburger at McDonalds has increased 55% since 2021. Earlier in this inflation cycle, restaurants could justify their price increases by pointing out similar price hikes at their fellow food peers – both restaurant competitors and grocery stores – but more affordable alternatives are starting to emerge. Recent economic data shows that CPI: Food Away From Home (the cost of dining out/getting takeout) is rising faster than CPI: Food At Home, or to put it more plainly, prices are rising faster at restaurants than at the grocery store.
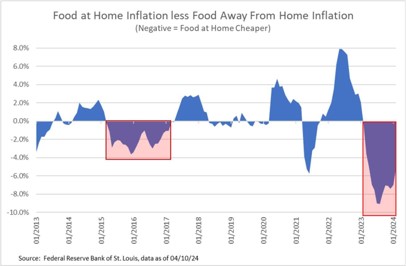
The last time a similar gap in the data emerged was in 2016-2018, a period which some industry observers named “The Value Wars,” where restaurant chains relied on more frequent discounts and value-oriented promotions in order to stand out to value-seeking consumers. It might be too early to call it a war, but the generals are rounding up their troops. In recent weeks, discussion from industry players such as Wendy’s, Brinker (owner of Chili’s and Maggiano’s), and Jack in the Box underscore a renewed emphasis on providing value, evidenced by Chili’s 3-for-Me, Wendy’s $5 Biggie Bag, or Jack’s Munchie Meal platform.
In this environment, we’re keeping a close eye on the health of the consumer and how their spending behaviors change. We look to avoid companies who have seen their relative value proposition erode after taking excessive menu pricing, or those who continue to face outsized cost pressures in food and labor. At the same time, we prefer those who have run their business in a more prudent manner in which the brand maintains their value-proposition for customers without sacrificing profitability.
Outlook
Since early 2022, the Federal Reserve has aggressively raised interest rates in an effort to lower inflation, causing significant uncertainty within stock and bond markets. While the rate of inflation has subsided, and the consensus appears to be we have reached an end to the Fed hiking cycle, declaring victory would be premature. The U.S. and rest of the world continue to manage the impacts of inflation, higher interest rates, and geopolitical events. In our assessment, there remains a possibility of Federal Reserve policy error and / or recession, though barring extraneous events, we still lean towards slowdown and not recession per se.
The biggest risk right now would seem to be from a “shock to the system” while we continue transitioning from the pandemic economy to a more normalized economy. Certainly, the traumatic events in Israel, and the risk of potential systemic shock that might spread from the Middle East, keep us up at night as we are sure they do you as well. As always, with our bias towards quality, we strive to mitigate any downside, while also participating in the upside.
Meanwhile, employment remains strong. Heavy fiscal stimulus from already passed U.S. legislation for defense, infrastructure, semiconductors, and energy investment are only now beginning to be awarded. The spending will not peak until later in the decade. Relatively high energy costs in Europe, and Germany in particular, makes manufacturing here relatively more attractive. Political risk in China makes that country less attractive to do business in. All told, U.S. manufacturing is being called upon to step up. Barring a major crisis, Ronald Reagan’s termed “willing workers” should be able to find jobs…and pay their bills. Furthermore, supply / demand imbalances in the labor market suggest further wage gains to come which will partially mitigate the impact of inflation on the consumer. We expect continued housing market pressures as a result of higher interest rates and affordability concerns. However, the shortage of housing after over a decade of underinvestment following the Great Financial Crisis should prevent a disastrous decline in home prices. Lower-income consumers have been most impacted by the current inflationary environment, but consumer balance sheets remain generally healthy for the majority of Americans, and consumer credit quality remains strong at the moment.
While what we see argues for a more inflationary and higher interest rate environment than seen in the past ten years, it also does not argue for a recession. Nonetheless, the unexpected can occur. Should a recession happen in the near term, the factors highlighted above suggest it could be less significant than the previous two recessionary periods. We are also mindful that 2024 is an election year, the result of which could have implications on companies, sectors and the overall economy.
Following years of lower interest rates helping to drive ever-higher growth-stock valuations, we feel value investing is ripe for a period of outperformance. We continue to find opportunities to invest in quality businesses with solid balance sheets and cash flows, whose share prices have detached from our assessment of the fundamentals. The bargains inherent in your portfolio should attract acquirers and other investors over time.
Steadfast, we remain committed to making you money while aiming to protect your wealth.
Disclosures:
You should carefully consider the investment objectives, potential risks, management fees, and charges and expenses of the Fund before investing. The Fund’s prospectus contains this and other information about the Fund, and should be read carefully before investing. You may obtain a current copy of the Fund’s prospectus by calling 1.877.336.6763.
Past performance is not a guarantee of future results.
As of 03/31/2024, the Fund contained 62 long positions in the portfolio representing companies with what management believes represents long-term value and favorable characteristics such as a discount to market value, attractive free cash flow yields, and strong balance sheets. The Fund’s top 10 long positions represented approximately 28% of the portfolio and included Progressive Corp (PGR) 3.7%, Eaton Corp (ETN) 3.3%, Leidos Holdings Inc (LDOS) 3.0%, Brown & Brown (BRO) 2.8%, Fairfax Financial Holdings (FRFHF) 2.8%, Pioneer Natural (PXD) 2.7%, Globe Life Inc (GL) 2.6%, Merck & Co (MRK) 2.5%, Abbott Labs (ABT) 2.4%, and Trimble Inc. (TRMB) 2.3%. Current and future portfolio holdings are subject to risk and change.
Important Risk Information
Investment in shares of a long/short equity fund have the potential for significant risk and volatility. A short equity strategy can diminish returns in a rising market as well as having the potential for unlimited losses. These types of funds typically have a high portfolio turnover that could increase transaction costs and cause short-term capital gains to be realized. The stocks in the Fund’s portfolio may decline in value or not increase in value when the stock market in general is increasing or decreasing in value and you could lose money. The Fund may lose money due to fluctuations within the stock market which may be unrelated to individual issuers and could not have been predicted. The price of the securities which the Fund holds may change unpredictably and due to local, regional, international, or global events. In the case of a general market downturn, multiple asset classes, or the entire market, may be negatively affected for an extended and unknown amount of time.
Risk Statistic Definitions:
Standard Deviation measures the volatility of the Fund’s returns. Beta measures the Fund’s sensitivity to market movements. Sharpe Ratio uses the Fund’s standard deviation and average excess return over the risk-free rate to determine reward per unit of risk. R-squared represents the percentage of the portfolio’s movements that can be explained by general market movements. Upside/Downside Capture Ratio measures a manager’s ability to generate an excess return above the benchmark return in up markets and retain more of the excess return in down markets. Risk statistics are relative to the S&P 500. Batting Average is a statistical measure used to evaluate an investment manager’s ability to meet or beat their index. Omega is a relative measure of the likelihood of achieving a given return. Max Drawdown is the peak-to-trough decline during a specific recorded period of an investment. Gross Exposure is the sum of the absolute values of the fund’s long and short exposures. Net Exposure is the fund’s total long exposure less the fund’s total short exposure.
The Expense Ratio, Gross of Any Fee Waivers or Expense Reimbursements, is 3.05%. The Expense Ratio, Net of Fee Waivers and Expense Reimbursements (contractual through 9/30/2024), is 3.00%. The Expense Cap is 1.95%. The Adviser has contractually agreed to waive or limit its fees to 1.95% and to assume other expenses of the Fund until September 30, 2024, so that the ratio of total annual operating expenses (not including interest, taxes, brokerage commissions, other expenditures which are capitalized in accordance with generally accepted accounting principles, other extraordinary expenses not incurred in the ordinary course of business, dividend expenses on short sales, expenses incurred under a Rule 12b-1 plan, acquired fund fees and expenses and expenses that the Fund incurred but did not actually pay because of an expense offset arrangement) does not exceed 1.95%.
Prospector Partners, LLC assumed investment management duties on 05-28-2015 and was formally approved by shareholders on 09-17-2015.
Morningstar US Long Short Fund Category – Long-short portfolios hold sizable stakes in both long and short positions. Some funds that fall into this category are market neutral – dividing their exposure equally between long and short positions in an attempt to earn a modest return that is not tied to the market’s fortunes. Other positions that are not market neutral will shift their exposure to long and short positions depending upon their macro outlook or the opportunities they uncover through bottom-up research.
The Fund is distributed by Ultimus Fund Distributors, LLC. (Member FINRA).