Current Market Environment
Don’t Fight The Fed
2021 began with a hopeful optimism of a soon-to-be vaccinated world, and our being able to put the COVID-19 pandemic in the rearview mirror. As the year progressed however, the reality was less sanguine, and a rollercoaster ride of setbacks, followed by incremental positives, followed by more setbacks ensued. An initially disjointed vaccine rollout gained momentum in the spring, but the take rate in the U.S. has been behind other industrialized nations. Additionally, by late summer it became apparent that COVID-19 was likely to become endemic, as the virus went through various mutations and the Delta variant caused a spike in infections – including reinfections and so called “breakthrough” cases of vaccinated individuals (although the vaccines remained highly effective against hospitalizations). Then, as we celebrated Thanksgiving, South Africa broke the news of the even more contagious Omicron variant, which would soon cause another, even worse spike. As of this writing, the U.S. is experiencing record daily cases and hospitalizations.
Despite these new variants, and other pandemic-related setbacks (e.g., supply-chain disruptions, worker shortages, and corresponding goods and services inflation), as well as non-COVID related concerns (e.g., the debt default of Chinese property developer Evergrande), the stock market climbed each of these proverbial “walls of worry” and the benchmark S&P 500 gained 28.7% for the year, setting 70 record highs along the way. Putting this march higher into further context: the benchmark closed the year fully 40% above its pre-pandemic high. While the multi-trillion dollar fiscal stimulus packages helped the U.S. consumer manage through the pandemic, this effort has been dwarfed by super-dovish Fed policy. In addition to holding interest rates low, the Federal Reserve has injected almost $5 trillion dollars into the economy via Quantitative Easing (see below chart for context), and is surely to thank for much of the market’s ebullience.
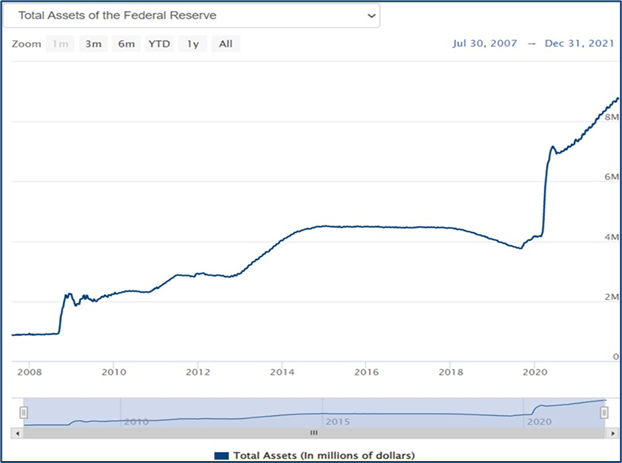
Source: U.S. Federal Reserve
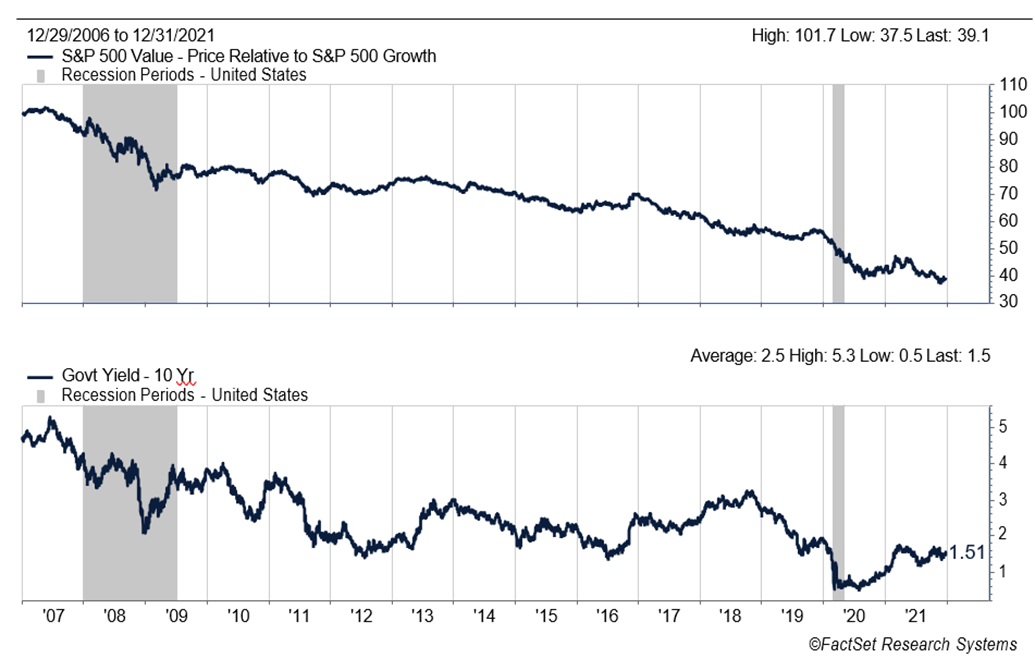
Given the Fed is now tapering asset purchases, and stands ready to raise interest rates in the upcoming months, this raises the inevitable question as to whether a more hawkish Fed will be bad for stocks. History is inconclusive when it comes to the overall market’s behavior during a period of Fed tightening. And, while there certainly will be stocks which are directly impacted by a higher Fed Funds Rate, we feel that focusing on Fed tightening alone would be missing the forest for the trees. More important in our minds, is the overall level of longer-term interest rates. In our opinon, a defining characteristic of the stock market over the past decade-plus has been the dominance of growth stocks over their value brethren. As can be seen in the following chart, this trend has had a very high correlation with ever-declining long-term bond yields during that period.
In our opinon, whether long-term bond yields will continue higher depends on a number of factors: the economy’s continued strength, the persistence of inflation, and whether the Fed acts too soon to name a few. On the latter point, we take the Fed at their word that they are willing to let inflation “run hot” for a bit, rather than act too soon – seemingly having learned a lesson from hiking rates too early following the Great Financial Crisis. While it remains to be seen how a less accommodative Fed will impact the overall stock market, as we’ve stated in past communications…we are much more comfortable with the risk / reward prospects of the value stocks held in your portfolio – especially when compared to, what we view as, the more richly-valued growth names which have been market favorites for so long, or the mega-cap technology stocks which dominate the S&P 500 Index.
Valuations Matter
Furthering that thought, it is also worth noting that notwithstanding the S&P 500’s stellar 2021 returns, many stocks are already in bear market territory. As discussed in our 1Q21 letter, loss-making companies and so-called “meme stocks” led the market during the early part of the year. Reminiscent of the “Dotcom Bubble,” these stocks traded to nosebleed multiples of revenues, with market commentators opining that traditional valuation metrics should be ignored – growth should be bought at any cost. As the year progressed, the air began to come out of the most speculative stocks. By way of example, the chart below is a composite of companies within the Russell 2000 Growth Index (small-cap growth stocks) which had negative earnings over the trailing twelve months. Contrary to the strong returns of the S&P 500 and other major market indices, the median return for these stocks for the full year 2021 was a decline of over 20% - but what is striking is how loved these stocks were during the preceding rally.
Composite of 517 companies in the Russell 2000 Growth Index with negative earnings: 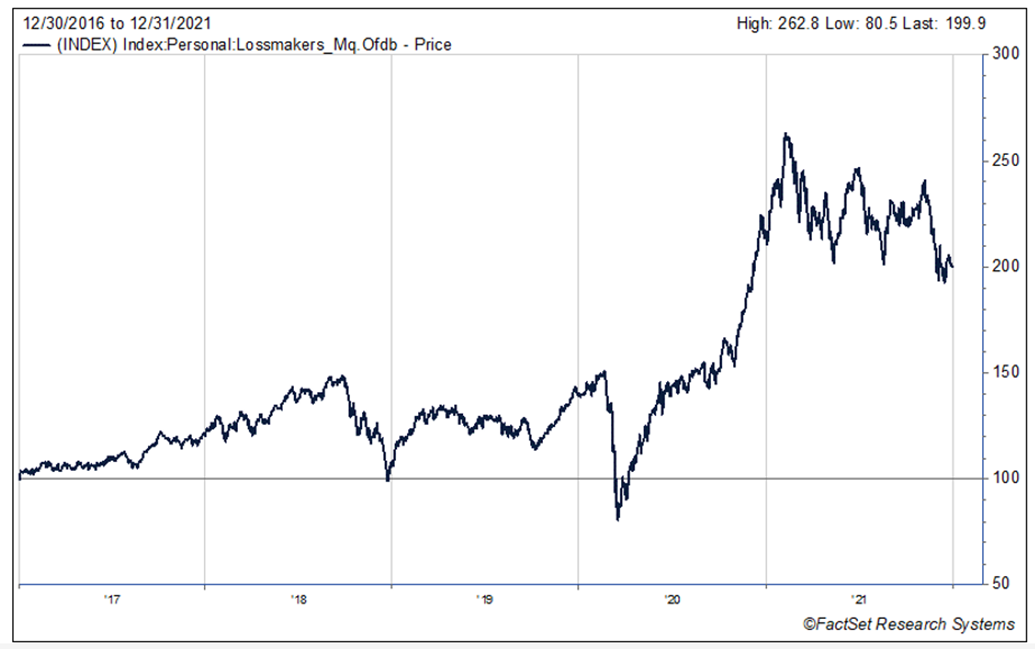
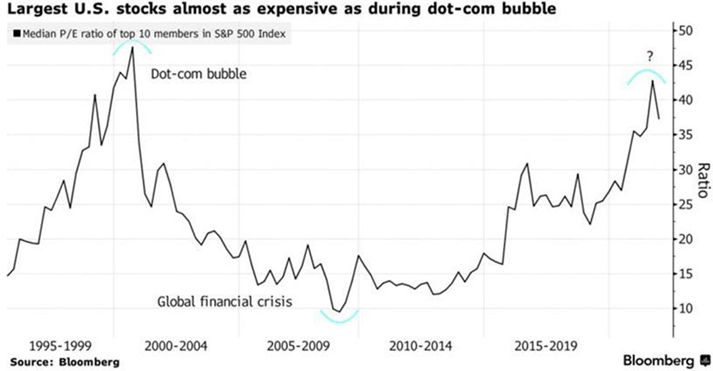
Time will tell, but it’s possible the selloff of speculative small-cap stocks is a so-called “canary in the coal mine.” Indeed, as 2022 has begun, we have seen a significant rotation from growth to value across market caps. This has even included the mega-cap technology stocks, which continue to command a heavy weighting in the S&P 500, accounting for most of the top ten largest companies in the index. Additionally, as can be seen below, these stocks have been afforded lofty valuations. Ultimately, we believe that as has been the case with small-cap speculative stocks, so too with the mega-cap tech darlings…valuations will matter.
The Future Is Electric
Within our industrial and technology holdings, a primary thesis holds that: to combat inflation and scarce labor, industry and society will do what humanity has done since the beginning of the species…create new and better tools that save labor and make life easier. We believe these technologies will predominately be electric and intelligent. We have embraced vehicle electrification; which besides environmental benefits will offer perhaps a 50% maintenance savings. We have also embraced digitization, automation, and the internet of things. We are not growth investors nor technology specialists. We have approached the area with our value toolkits of cash flows, balance sheets and private market value. We also typically seek candidates that will broadly benefit from these themes. We try to avoid higher-risk bets on undiversified unproven new technologies, and on unproven startups. With that as a backdrop, we delve into some of these investments in the following paragraphs.
One of the Fund’s largest purchases during the fourth quarter was the initiation of a position in Sensata Technologies Holdings PLC (ST), a maker of sensors and electrical protection technologies. About 60% of its sales are into automotive, about 15% into heavy-duty vehicles, and the rest in aerospace, HVAC, and other industrial markets. The future looks bright. Management believes they can double their content per vehicle in an electric vehicle compared to an internal combustion engine vehicle. Despite this long- term upside, we believe the market undervalues the stock because of the short-term impacts of the ongoing semiconductor shortage, which has reduced global vehicle production. Sensata, largely an auto supplier, has seen sales disappoint, and its stock has been weak. The semiconductor shortage stems from the halting nature of the COVID recovery. This has been a supply-driven problem, not a demand problem; and production will return. Consumer balance sheets, especially in the U.S., are solid and there is a demand for cars. Dealer inventories are thin and the Mannheim used vehicle price index is up 47% year over year due to consumers being forced into the used market for the lack of new vehicles. Auto production averaged 93 million vehicles globally pre-COVID, then fell to 75 million in 2020 and 76 million in 2021. It is expected to recover strongly in the coming years to the mid-to-high 90 million. It will need to reach these heights to both meet normal recurring demand, as well as to restock dealer inventories laid bare by the current production deficit. So, we can expect medium term cyclical strength, followed by the secular wave of electrification beyond. The next ten years should be good for Sensata.
In Summer 2021, CMC Materials, Inc. (CCMP) was a significant initiation. CCMP supplies materials to semiconductor manufacturers to clean and polish wafers. CCMP is a technology leader, and the demand for their products is growing due to the increasingly complex nature of the chips being designed. CCMP serves most manufacturers and will broadly benefit from industry growth. Semiconductors will be at the core of electrification, digitization, automation and the internet of things. Per our strategy, we are not at this time betting on any one chip technology or any one firm. In an industry that is typically expensive for our tastes, we were able to opportunistically buy after a string of disappointments made the free cash flow yield attractive. Apparently, one of CCMP’s larger peers, Entegis, Inc. (ENTG), agreed with us and agreed to purchase the Company in the fourth quarter at a premium to our investment.
Like Sensata, portfolio holding Littelfuse, Inc. (LFUS) makes small electric control and protection devices that are broadly distributed through a vehicle. It serves about 1/3 automotive, 1/3 industrial, and 1/3 electronics markets. Management believes content for some of their parts will grow 6-8x in an electric vehicle compared to an internal combustion vehicle. They also benefit from other growing markets in electronics such as data center construction, which is being driven by the move to the cloud which in turn is being driven by the need for increased economic efficiency.
Cleveland based Eaton Corp. plc (ETN) is perhaps our earliest investment in electrification. The company is one of the globe’s largest suppliers of electric equipment to the utility, industrial, government, and technology customer bases. It is a leader in data center products. Management sees growth both in electric infrastructure, and in vehicles. In vehicles, it is focused on the same circuit protection trends as Littelfuse. In infrastructure, management sees that with the rise in electric vehicles, our neighborhoods and large corporate sites will need to have their infrastructures significantly upgraded.
Outlook
2022 is setting up, what we believe, will be a pivotal year. In our opinion, much will depend on how successful the Federal Reserve is at transitioning from an ultra-stimulative posture, to a less accommodative one. At this point, it appears that the U.S. consumer remains resilient, with healthy balance sheets following trillions in fiscal stimulus. While COVID-19 infection rates and hospitalizations remain high, immunity from prior infections, increasing vaccinations, and release of anti-virals should help further the reopening of our economy.
While interest and mortgage rates have lifted, they are coming off historically low levels. We are seeing reinflation in many areas of the economy, and are watching this closely given the historically high levels of government spending here and around the world. Unemployment has shown significant improvement, but labor continues to be an issue, as the participation rate continues to be low and labor shortages are impacting many industries.
In our estimation, overall equity valuations remain at elevated levels. The high valuations of a small number of enormous technology companies certainly exert upward pressure to the overall averages. Treasury and high-grade corporate bond yields look unattractive. In any case, value investing is ripe for a period of outperformance, and the bargains inherent in your portfolio should attract acquirers and other investors over time. Meanwhile, we still believe equities represent a superior asset allocation alternative to bonds over the longer term.
Steadfast, we remain committed to attempting to make you money while aiming to protect your wealth.
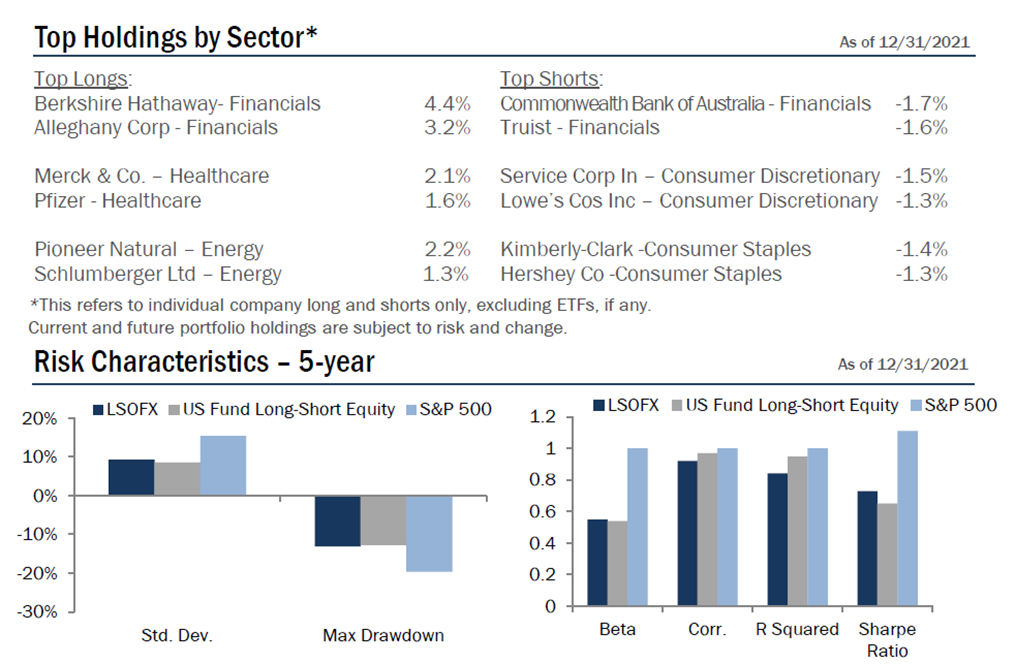
Portfolio Overview
Disclosures:
You should carefully consider the investment objectives, potential risks, management fees, and charges and expenses of the Fund before investing. The Fund’s prospectus contains this and other information about the Fund, and should be read carefully before investing. You may obtain a current copy of the Fund’s prospectus by calling 1.877.336.6763.
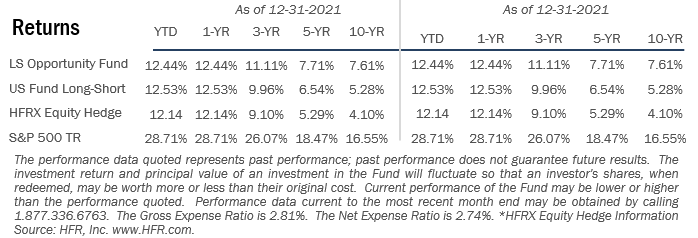
Past performance is not a guarantee of future results.
IMPORTANT RISK INFORMATION
Investment in shares of a long/short equity fund have the potential for significant risk and volatility. A short equity strategy can diminish returns in a rising market as well as having the potential for unlimited losses. These types of funds typically have a high portfolio turnover that could increase transaction costs and cause short-term capital gains to be realized. The stocks in the Fund’s portfolio may decline in value or not increase in value when the stock market in general is increasing or decreasing in value and you could lose money. The Fund may lose money due to fluctuations within the stock market which may be unrelated to individual issuers and could not have been predicted. The price of the securities which the Fund holds may change unpredictably and due to local, regional, international, or global events. In the case of a general market downturn, multiple asset classes, or the entire market, may be negatively affected for an extended and unknown amount of time.
Risk Statistic Definitions:
Standard Deviation measures the volatility of the Fund’s returns. Beta measures the Fund’s sensitivity to market movements. Sharpe Ratio uses the Fund’s standard deviation and average excess return over the risk-free rate to determine reward per unit of risk. R-squared represents the percentage of the portfolio’s movements that can be explained by general market movements. Upside/Downside Capture Ratio measures a manager’s ability to generate an excess return above the benchmark return in up markets and retain more of the excess return in down markets. Risk statistics are relative to the S&P 500. Batting Average is a statistical measure used to evaluate an investment manager’s ability to meet or beat their index. Omega is a relative measure of the likelihood of achieving a given return. Max Drawdown is the peak-to-trough decline during a specific recorded period of an investment. Gross Exposure is the sum of the absolute values of the fund’s long and short exposures. Net Exposure is the fund’s total long exposure less the fund’s total short exposure. The Expense Ratio, Gross of Any Fee Waivers or Expense Reimbursements, is 2.81%. The Expense Ratio, Net of Fee Waivers and Expense Reimbursements (contractual through 9/30/2022), is 2.74%. The Expense Cap is 1.95. The Adviser has contractually agreed to waive or limit its fees to 1.95% and to assume other expenses of the Fund until September 30, 2022, so that the ratio of total annual operating expenses (not including interest, taxes, brokerage commissions, other expenditures which are capitalized in accordance with generally accepted accounting principles, other extraordinary expenses not incurred in the ordinary course of business, dividend expenses on short sales, expenses incurred under a Rule 12b-1 plan, acquired fund fees and expenses and expenses that the Fund incurred but did not actually pay because of an expense offset arrangement) does not exceed 1.95%.
Prospector Partners, LLC assumed investment management duties on 05-28-2015 and was formally approved by shareholders on 09-17-2015.
Effective November 30, 2020, the Morningstar US Long Short Fund Index replaced the HFRX Equity Hedge Index as the Fund's performance benchmark because the Morningstar US Long Short Fund more closely aligns with the Fund's investment strategy and portfolio composition.
Morningstar US Long Short Fund Category – Long-short portfolios hold sizable stakes in both long and short positions. Some funds that fall into this category are market neutral – dividing their exposure equally between long and short positions in an attempt to earn a modest return that is not tied to the market’s fortunes. Other positions that are not market neutral will shift their exposure to long and short positions depending upon their macro outlook or the opportunities they uncover through bottom-up research.
HFRX Equity Hedge Index - Equity Hedge strategies maintain positions both long and short in primarily equity and equity derivative securities. A wide variety of investment processes can be employed to arrive at an investment decision, including both quantitative and fundamental techniques; strategies can be broadly diversified or narrowly focused on specific sectors and can range broadly in terms of levels of net exposure, leverage employed, holding period, concentrations of market capitalizations and valuation ranges of typical portfolios. Equity Hedge managers would typically maintain at least 50%, and may in some cases be substantially entirely invested in equities, both long and short. The HFR Indices are being used under license from HFR, Inc., which does not approve of or endorse any of the products or the contents discussed in this material.
†† The Morningstar Rating for funds, or "star rating", is calculated for managed products (including mutual funds, variable annuity and variable life subaccounts, exchange-traded funds, closed-end funds, and separate accounts) with at least a three-year history Exchange-traded funds and open-ended mutual funds are considered a single population for comparative purposes It is calculated based on a Morningstar Risk-Adjusted Return measure that accounts for variation in a managed product's monthly excess performance, placing more emphasis on downward variations and rewarding consistent performance The top 10% of products in each product category received 5 stars, the next 22 5% receive 4 stars, the next 35% receive 3 stars, the next 22 5% receive 2 stars, and the bottom 10% receive 1 star. The Overall Morningstar Rating for a managed product is derived from a weighted average of the performance figures associated with its three-, five-, and 10-year (if applicable) Morningstar Rating metrics The weights are: 100% three-year rating for 36-59 months of total returns, 60% five-year rating/40% three-year rating for 60-119 months of total returns, and 50% 10-year rating/30% five-year rating/20% three-year rating for 120 or more months of total returns While the 10-year overall star rating formula seems to give the most weight to the 10-year period, the most recent three-year period actually has the greatest impact because it is included in all three rating periods. Across the US Long Short Equity category, as of12/31/2021, the LS Opportunity Fund received 3 stars among 179 funds, 3 stars among 154 funds, and 4 stars among 54 funds for the 3-, 5-, and 10-year periods, respectively.
The Fund is distributed by Ultimus Fund Distributors, LLC. (Member FINRA).
14376539-UFD-01282022