Current Market Environment
Cases of whiplash must have spiked lately. After all, in a few short months, market commentators have abruptly transitioned from: “inflation is transitory” to “inflation might be more persistent” and now “prepare for stagflation!” As discussed in our last writing, the stock market had appeared to be fully in the Fed’s camp, perceiving the recent spike in inflation as a temporary phenomenon. This sentiment persisted through much of the third quarter, as COVID-19 cases once again ramped higher due to the rise of the more transmittable Delta variant. The increase in cases triggered concerns of a slowdown, a reduction in some estimates of economic growth, a continued decline in U.S. government bond yields, and investors flocking back to technology and growth stocks. These market trends quickly reversed late in the quarter, as the Fed increased their expectations for inflation and indicated they would start tapering asset purchases sooner than expected. Government bond yields quickly lifted, with the all-important 10-year Treasury rising from around 1.30% to 1.54% over the next several trading days. Value stocks, especially banks and financial service companies, rallied in tow.
While concerns over a Delta-variant induced slowdown have abated somewhat, supply bottlenecks around the world have become markedly worse as demand for goods has outpaced the ability to get those goods to market. Part of the blame has been placed on a lack of truckers to transport the goods. It was recently reported that nearly half a million cargo containers were sitting off the coast of California as cargo ships are waiting to be offloaded – with some potentially waiting for a month. This not only puts the Christmas shopping season at risk for retailers, but has also already led to an increase in the price of many goods. Meanwhile, energy prices around the world have taken off, also due to supply/demand imbalances. For example, liquefied natural gas prices (heavily relied upon in Europe and Asia) have skyrocketed on those continents to $40/mmbtu from $6/mmbtu in late February, while oil has been driven up to over $80 a barrel, from near $50 at the beginning of the year.
While most of these supply issues may prove to be temporary, the inflationary impacts could be more persistent – especially if labor shortages lead to wage increases, which tend to be sticky. Will these inflationary pressures be such that they cause enough demand destruction so as to lead to stagflation? As we’ve stated before, we do not purport to be economists, however, we do take some comfort in the overall health of the consumer. As can be seen in the chart below, the U.S. consumer’s balance sheet is currently in great shape, with debt service as a percentage of disposable personal income at record lows. This has undoubtedly been aided by massive government stimulus, and should help consumers withstand this period of rising cost pressures much more readily than they would have, say, a decade ago.
With that said, it is appropriate to consider the portfolio implications if we are indeed headed towards a period of persistent inflation and stagnant economic growth. While no two periods are directly comparable (for example, the environment today is very different than that of the 1970’s, when we last saw stagflation), we would expect defensive sectors such as consumer staples and healthcare to outperform given their more stable business models and ability to exhibit pricing power. We would also expect a flight to quality generally, including the outperformance of companies with above-average balance sheet strength. Notably, Morgan Stanley recently issued a report which looked at periods in which “…markets assigned a non-trivial probability to stagflation as a tail risk...” Their data showed that defensive sectors did indeed outperform during these periods, as did energy. In addition, credit spreads widened as fears of stagflation entered public discourse, adding credence to our belief that quality would outperform in such an environment. Also worth noting: according to work performed by RBC, banks outperformed through three stagflationary periods during the 1960’s and 1970’s.
Portfolio Spotlight - Merck
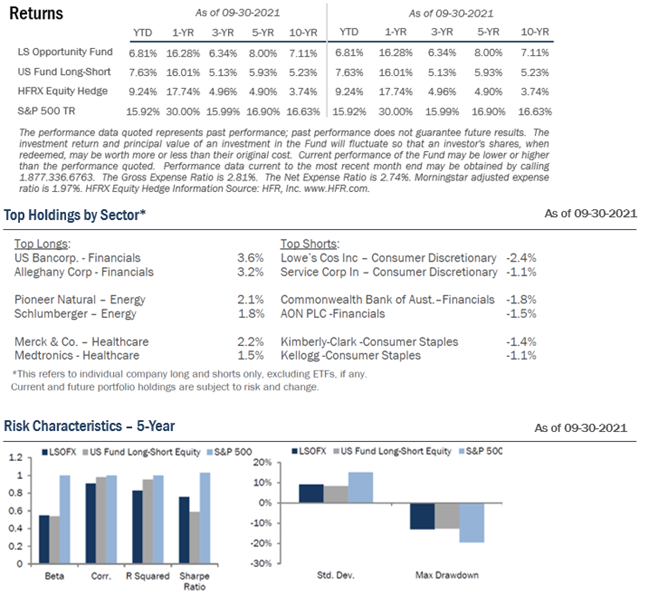
Long-time portfolio holding Merck & Co. [(MRK), 2.2% allocation] is a global healthcare company which engages in the research & development of pharmaceuticals, vaccines, and animal health products. Given the company has recently been in the headlines and is the largest healthcare position in your portfolio, an update seems timely. Merck recently announced interim Phase III clinical data for Molnupiravir, an oral antiviral for the treatment of COVID-19, which indicated the drug reduced the risk of hospitalization by approximately 50%. Merck submitted an application for Emergency Use Authorization (EUA) with the FDA based on this clinical data. The approval of Molnupiravir may potentially be a major victory in the fight against COVID- 19, as it would be the first antiviral that could be taken at home. Some have estimated that successful antivirals will receive global orders from governments in excess of $20 billion – given the lack of effective antivirals, this is a potential windfall for Merck.
We view Molnupiravir as an embedded “call option,” and not an essential part of the thesis. In our opinion, Merck has continually been under-valued by the market since we first initiated the position in 2013. The company is projected to generate over $14 billion in free cash flow in the next calendar year, equating to a healthy 7% free cash flow yield. The 11.6x forward P/E ratio is an approximate two multiple point discount versus the peer group, and MRK currently offers a robust 3.5% dividend yield. This is despite an estimated double-digit EPS growth CAGR over the next five years, not including potential upside from Molnupiravir. We also like how the pharma sector is currently out of favor by generalists, with the sector being inexpensive on an absolute and relative basis.
On a sum-of-the-parts basis, we value Merck (which currently trades around $80/share) at just over $100 by valuing the core pharmaceutical / vaccine and animal health businesses separately. This results in another embedded call option in the stock if the company decides to spin-out or sell the higher multiple animal health business, which could potentially trade at 30x+ EPS.
The primary reason for Merck’s steep discount is ironically due to the major success of its blockbuster cancer drug Keytruda. This drug represented 30% of Merck’s sales in 2020 and continues to grow, continually surpassing Wall Street expectations as indications for the drug keep expanding. By way of example, when we first initiated our position, Street estimates saw Keytruda peak sales of around $4 billion…The drug is expected to produce revenues of close to $20 billion in 2022. Despite the success of the drug, investors are concerned with Merck’s ability to replace the Keytruda’s revenue following the entrance of competition from generics (the first of a series of major patent expirations begins in 2028).
That said, we are encouraged by steps the company is taking to diversify away from the blockbuster cancer drug. This year, Merck partnered with Gilead Sciences to jointly develop and commercialize treatments for HIV. Merck’s Islatravir and Gilead’s Lenacapavir have potential to become blockbuster drugs if successful in late-stage trials. These drugs represent potential game changers in the management of HIV. Merck is also leveraging its strong balance sheet to supplement the internal pipeline by engaging in M&A. Recently, Merck announced the $11.5 billion acquisition of Acceleron, which is developing a pulmonary hypertension drug with strong clinical results. This drug is another asset which can achieve multi-billion dollars in annual sales. This deal is in addition to small bite-sized acquisitions over the recent past, such as the purchases of Pandion and Peloton (not to be confused with the fitness company).
Merck retains the optionality and capacity to engage in additional business development opportunities. The company maintains a strong balance sheet which will enable the company to pursue additional M&A and is rated A+ by S&P. It is also estimated that Merck will generate $100+ billion in free cash flow over the next five years. We expect a large portion of free cash flow will be used to support business development. We also applaud the spin-out of the Organon segment into a publicly traded company, which occurred in June. Organon is a collection of legacy off-patent drugs, biosimilars, and women’s health products. The rationale for the spin-out was to prioritize higher-value and faster-growth franchises within Merck, achieve $1.5 billion in pre-tax expense saves over three years, and use $9 billion in tax-free cash proceeds from the spin-co to reinvest into the pipeline. As a result, we expect substantial operating margin expansion in coming years and a sharper focus on product research & development.
Additionally, we feel investors are shrugging off Merck’s internal pipeline and current (non-Keytruda) drug lineup. The company is pursuing large potential opportunities within its oncology, vaccine, hematology, and immunology businesses. We also like the growth prospects for approved assets such as Gardasil and Lynparza, along with steady and more predictable growth from the vaccine and animal health franchises.
Merck has a variety of options, and ample time to replace lost revenue from Keytruda’s initial loss of exclusivity in 2028. While investor sentiment remains low for Merck, positive portfolio readouts, the success of Molnupiravir, and attractive M&A, can positively sway investor perception over time. Also, the loss of Keytruda exclusivity in 2028 is the worst-case scenario. Through various co-formulations under development, Merck can potentially extend the effective patent life of Keytruda well into the next decade. Additionally, the patent expiration is not a revenue “cliff-event” per say. It often takes years for generic competition and prescriber adoption to gradually erode sales of the name-brand drug they are replicating. In the iconic words of Mick Jagger, we can claim “time is on my side” when it comes to your investment in Merck.
Outlook
2021 looks to be a transitional year. We continue to be in the midst of an economic recovery, following the coronavirus-induced recession of 2020. Continued progress on vaccinations and therapeutics should allow the U.S. economy to return to more familiar footing with the resumption of dining out, air travel for business and pleasure, and large group gatherings. The 2020 United States elections, although closely contested, ushered in a change in administration with attendant changes in the agenda around stimulus, spending, taxes, and trade. The razor-thin margins in Congress are likely to temper any radical policy shifts.
While interest and mortgage rates have lifted, they are coming off historically low levels. We are seeing reinflation in many areas of the economy, and are watching this closely given the historically high levels of government spending here and around the world. We are carefully monitoring aggregate corporate debt levels (especially BBB- debt which is a single notch above junk status), currently above pre-2008 crisis levels and loom as a potential problem absent continued aggressive Fed support. Unemployment has shown significant improvement, but labor continues to be an issue, as the participation rate continues to be low and labor shortages are impacting many industries.
In our estimation, overall equity valuations remain at elevated levels. The high valuations of a small number of enormous technology companies certainly exert upward pressure to the overall averages. Aggregate earnings are quickly recovering, however unevenly. Certain industries such as hospitality, entertainment and travel, which are tied to the success of the vaccine rollout plan, will take longer to return to pre-coronavirus levels. Treasury and high-grade corporate bond yields look unattractive. In any case, value investing is ripe for a period of outperformance, and the bargains inherent in your portfolio should attract acquirers and other investors over time. Meanwhile, we still believe equities represent a superior asset allocation alternative to bonds over the longer term.
Steadfast, we remain committed to making you money while aiming to protect your wealth.
Portfolio Overview
13787196-UFD-10292021
Disclosures:
You should carefully consider the investment objectives, potential risks, management fees, and charges and expenses of the Fund before investing. The Fund’s prospectus contains this and other information about the Fund, and should be read carefully before investing. You may obtain a current copy of the Fund’s prospectus by calling 1.877.336.6763.
Past performance is not a guarantee of future results.
Important Risk Information
Investment in shares of a long/short equity fund have the potential for significant risk and volatility. A short equity strategy can diminish returns in a rising market as well as having the potential for unlimited losses. These types of funds typically have a high portfolio turnover that could increase transaction costs and cause short-term capital gains to be realized. The stocks in the Fund’s portfolio may decline in value or not increase in value when the stock market in general is increasing or decreasing in value and you could lose money. The Fund may lose money due to fluctuations within the stock market which may be unrelated to individual issuers and could not have been predicted. The price of the securities which the Fund holds may change unpredictably and due to local, regional, international, or global events. In the case of a general market downturn, multiple asset classes, or the entire market, may be negatively affected for an extended and unknown amount of time.
Risk Statistic Definitions:
Standard Deviation measures the volatility of the Fund’s returns. Beta measures the Fund’s sensitivity to market movements. Sharpe Ratio uses the Fund’s standard deviation and average excess return over the risk-free rate to determine reward per unit of risk. R-squared represents the percentage of the portfolio’s movements that can be explained by general market movements. Upside/Downside Capture Ratio measures a manager’s ability to generate an excess return above the benchmark return in up markets and retain more of the excess return in down markets. Risk statistics are relative to the S&P 500. Batting Average is a statistical measure used to evaluate an investment manager’s ability to meet or beat their index. Omega is a relative measure of the likelihood of achieving a given return. Max Drawdown is the peak-to-trough decline during a specific recorded period of an investment. Gross Exposure is the sum of the absolute values of the fund’s long and short exposures. Net Exposure is the fund’s total long exposure less the fund’s total short exposure. The Expense Ratio, Gross of Any Fee Waivers or Expense Reimbursements, is 2.81%. The Expense Ratio, Net of Fee Waivers and Expense Reimbursements (contractual through 9/30/2022), is 2.74%. The Morningstar calculated expense cap ratio, which reflects what the investor would have paid, is 1.97%.The Expense Cap is 1.95. The Adviser has contractually agreed to waive or limit its fees to 1.95% and to assume other expenses of the Fund until September 30, 2022, so that the ratio of total annual operating expenses (not including interest, taxes, brokerage commissions, other expenditures which are capitalized in accordance with generally accepted accounting principles, other extraordinary expenses not incurred in the ordinary course of business, dividend expenses on short sales, expenses incurred under a Rule 12b-1 plan, acquired fund fees and expenses and expenses that the Fund incurred but did not actually pay because of an expense offset arrangement) does not exceed 1.95%.
Prospector Partners, LLC assumed investment management duties on 05-28-2015 and was formally approved by shareholders on 09-17-2015.
Effective November 30, 2020, the Morningstar US Long Short Fund Index replaced the HFRX Equity Hedge Index as the Fund's performance benchmark because the Morningstar US Long Short Fund more closely aligns with the Fund's investment strategy and portfolio composition.
Morningstar US Long Short Fund Category – Long-short portfolios hold sizable stakes in both long and short positions. Some funds that fall into this category are market neutral – dividing their exposure equally between long and short positions in an attempt to earn a modest return that is not tied to the market’s fortunes. Other positions that are not market neutral will shift their exposure to long and short positions depending upon their macro outlook or the opportunities they uncover through bottom-up research.
HFRX Equity Hedge Index - Equity Hedge strategies maintain positions both long and short in primarily equity and equity derivative securities. A wide variety of investment processes can be employed to arrive at an investment decision, including both quantitative and fundamental techniques; strategies can be broadly diversified or narrowly focused on specific sectors and can range broadly in terms of levels of net exposure, leverage employed, holding period, concentrations of market capitalizations and valuation ranges of typical portfolios. Equity Hedge managers would typically maintain at least 50%, and may in some cases be substantially entirely invested in equities, both long and short. The HFR Indices are being used under license from HJJFR, Inc., which does not approve of or endorse any of the products or the contents discussed in this material.
†† The Morningstar Rating for funds, or "star rating", is calculated for managed products (including mutual funds, variable annuity and variable life subaccounts, exchange-traded funds, closed-end funds, and separate accounts) with at least a three-year history Exchange-traded funds and open-ended mutual funds are considered a single population for comparative purposes It is calculated based on a Morningstar Risk-Adjusted Return measure that accounts for variation in a managed product's monthly excess performance, placing more emphasis on downward variations and rewarding consistent performance The top 10% of products in each product category received 5 stars, the next 22 5% receive 4 stars, the next 35% receive 3 stars, the next 22 5% receive 2 stars, and the bottom 10% receive 1 star. The Overall Morningstar Rating for a managed product is derived from a weighted average of the performance figures associated with its three-, five-, and 10-year (if applicable) Morningstar Rating metrics The weights are: 100% three-year rating for 36-59 months of total returns, 60% five-year rating/40% three-year rating for 60-119 months of total returns, and 50% 10-year rating/30% five-year rating/20% three-year rating for 120 or more months of total returns While the 10-year overall star rating formula seems to give the most weight to the 10-year period, the most recent three-year period actually has the greatest impact because it is included in all three rating periods. Across the US Long Short Equity category, as of 9/30/2021, the LS Opportunity Fund received 3 stars among 179 funds, 4 stars among 157 funds, and 4 stars among 50 funds for the 3-, 5-, and 10-year periods, respectively.
The Fund is distributed by Ultimus Fund Distributors, LLC. (Member FINRA).
For Financial Professional Use Only.