Current Market Environment
According to ESPN major league baseball (MLB) analyst, Doug Glanville, MLB instituted the “warning track” in 1949. This came after a Brooklyn Dodgers outfielder named Pete Reiser repeatedly crashed into the outfield wall, and continually injured himself. For non-baseball fans: the warning track is a strip of material averaging 15 feet wide, which serves to warn outfielders intently focused on catching a fly ball that they are dangerously close to colliding into the wall. While we are unsure if Fed Chairman Jerome Powell is a fan of our national pastime, or has been to an MLB park for that matter, we would strongly suggest he heed the metaphorical warning track in front of him. With his sights set on “catching” high inflation, and not stopping until he does, he risks slamming into the wall…only to have inflation continue its descent into the bleachers beyond him.
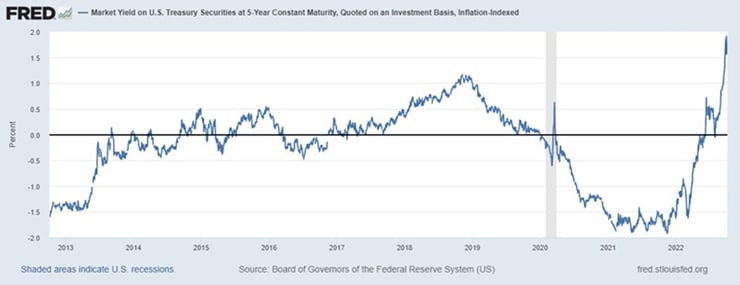
Given the market response to Powell’s September 21st press conference, it seems clear we are not alone in this concern. After that day’s Fed meeting, where the central bank raised interest rates by 0.75% for an unprecedented third consecutive time, Powell indicated that he did not think inflation could cool without a significant increase in the unemployment rate and stated the Federal Reserve is “strongly committed to bringing inflation back down to our 2% goal.” This hawkishness, and apparent unwillingness to slow interest rate hikes while the ramifications of an unprecedented tightening play out, caused a sharp decline in both stocks and bonds on fears the Fed will overshoot the mark and lead the economy into a severe recession. As seen in the chart below, in a very short time span, real interest rates have risen over 400 basis points, an extremely restrictive move. Meanwhile, housing prices have fallen significantly in recent months, other asset prices such as the stock market have also lost a tremendous amount of value, and consumer sentiment has nosedived - factors likely to lead to a continued slowdown in the economy and inflation.
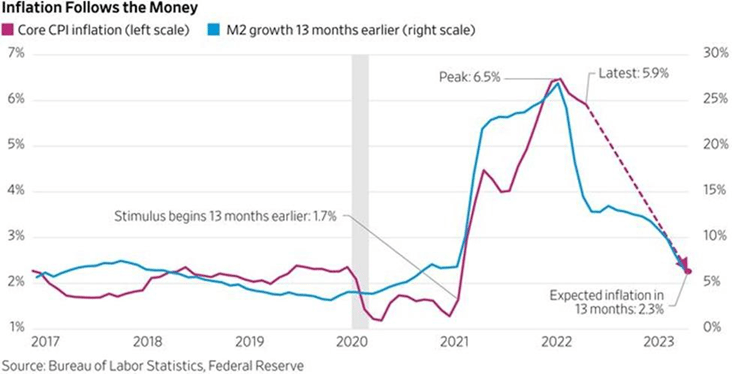
Much as we felt the Federal Reserve was behind the curve over a year ago, and that inflation would prove to be more than transitory, we now find ourselves concerned the central bank is myopically focused on lagging indicators and in danger of causing severe damage to the economy. Inflation doesn’t turn on a dime, and patience would be prudent. Indeed, the Wall Street Journal recently pointed out that money supply growth (as measured by M2 money) has been a near perfect predictor of future inflation with a 13-month lag (see chart below). Just as the massive fiscal response to the COVID-19 pandemic led to a historic rise in money supply, and inflation thereafter, the normalization of M2 should also lead to a cooling in inflation…but this takes time.
Against this backdrop of pronounced market volatility, historic moves in interest rates and currencies (e.g., the U.S. dollar is at historic highs against the British pound), as well as various fiscal and monetary responses from world governments, fears of a “Lehman-style collapse” routinely percolate through the market. Recently, for example, the UK entered into a series of questionable moves as newly appointed Prime Minister Liz Truss announced unfunded tax cuts – an action which added fuel to the selloff in UK bonds and a sharp decline in the British pound. This led the Bank of England to step in with quantitative easing to try to stem the slide in the long-term gilt market (a selloff that reportedly was imperiling pension funds met with margin calls). Counterintuitively, this all comes at a time when the UK, much like the U.S., is tightening policy by raising interest rates in an effort to stem inflation. Soon after this series of events, reports surfaced that investment banks were also facing losses related to the pound and UK bonds and rumors of Credit Suisse’s demise made their rounds.
While we are unsure how the Credit Suisse situation will ultimately play out, we are more confident that volatility will persist in the near term. Markets are on edge – searching for any sign that the Fed is nearing a dovish pivot and reacting harshly to any piece of news indicating the economy or job market is running hotter than expected. It increasingly feels like we are at a crossroads, where the Federal Reserve could either slow the pace of tightening and observe the impacts of the substantive actions already taken, or continue their current aggressive stance, risking a deep recession. As often happens during bear markets, the vast majority of stocks are declining, and correlations amongst them have increased – this creates opportunities for active managers. That said, owning high-quality companies with solid balance sheets and reliable cash flows makes sense now more than ever. After all, “in order to finish first, you must first finish.”
Insurance Industry Update
Our hearts go out to those who have recently felt the devastating impacts from Hurricanes Fiona and Ian. Given these events are likely to have a material effect on the property-casualty insurance industry, where we maintain significant exposure, an update seems warranted. We also maintain an overweight position to the life insurers, and thus offer updated thoughts on that sector below as well. In short, we find the fundamental backdrop for insurance names to be constructive, particularly relative to other sectors in this volatile environment.
The property-casualty insurance industry has pricing power today. Insurance companies have been increasing prices for most lines of insurance for several years now. Those increases are the result of several factors, including meaningful catastrophe losses, and the reemergence of both social and physical inflation. We have seen some of the benefits of these actions, particularly in revenues and margins, but expect to see additional benefit as the compounding effect of years of rate increases are recognized. Additionally, the significant increase in interest rates this year affords the ability to accelerate investment income growth, an important factor to returns long forgotten by investors during the era of “lower for longer” interest rates. The combination of improved underwriting margins and net investment income should produce relatively impressive results.
Hurricane Ian is likely to be a historically relevant insurance event. Early estimates of insurance industry losses range from $42B-$74B, a level of losses that will create much turmoil in the Florida market and likely accelerate recent pricing trends in the catastrophe reinsurance market. We maintain positions in several companies likely to benefit from these outcomes, and have recently increased our positions in insurance brokers – who will benefit from resultant price increases yet do not have the balance sheet risk of the underwriters.
The life insurance industry has been significantly impacted by the COVID era. Mortality claims have exceeded actuarial assumptions through much of the period and the difficult investment environment has pressured a significant source of income for the industry. Fortunately, vaccines and therapies have had an important impact on mortality, and recent results indicate that a more “normal” environment may be upon us. We cannot help but also wonder if mortality losses have been “pulled forward” – i.e., might mortality now be better than assumed for a period of time? Earnings and cash flow expectations do not appear to reflect this hypothesis. As is the case with property-casualty insurance companies, life insurers have been forced to operate in a “lower for longer” interest rate world for a long time, pressuring both income statements and balance sheets; the significant improvement in yield environment will accrue to life insurers’ financials over time, but the valuation attributed to the space may improve more quickly.
Lastly, the life insurance industry will soon be incorporating new GAAP accounting for long-duration products. Companies have started to give some guidance for the impact in 2023 and beyond, but much remains unknown. It is worth noting the accounting changes do not affect the economics or cash flows of the business; however, the change in accounting seems likely to shine a light on those products with favorable attributes, specifically, traditional life insurance. Our attention has long been on companies that focus on these products, as we find the predictability of cash flows, lower operating leverage, and reduced balance sheet risks associated with those products to offer more attractive investment opportunities. We maintain significant positions in this sector.
Investment Objective
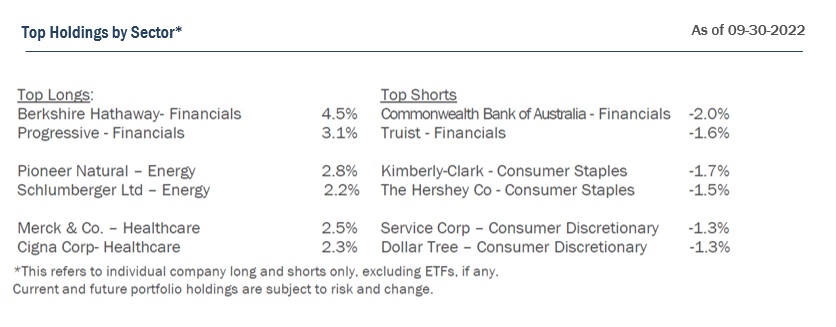
The Fund seeks to achieve capital appreciation through a concentrated portfolio of long and short equity positions. The Fund’s long portfolio also holds significant positions in stable, recession-resistant companies. Moreover, the consistently generated free cash flows make these companies attractive merger partners. The key principles that guide the investment philosophy are protection of the downside and value orientation. The Fund’s portfolio is constructed with these principles in mind.
Outlook
Equity and bond market declines have been pronounced. The Federal Reserve has aggressively raised interest rates in an effort to lower inflation, and equity and bond markets are likely to remain volatile until investors sense the Fed is about to pivot to a less restrictive stance. The U.S. and rest of the world continue to manage the impacts of high inflation, Russia’s invasion of Ukraine, and China’s “zero-COVID” policy. In our assessment, markets reflect a reasonably high probability of recession.
Employment remains strong. Supply/demand imbalances in the labor market bode well for the health of the consumer given full employment and the prospect for further wage gains, which partially mitigates the impact of inflation on the consumer. We expect continued pressure on housing prices as a result of higher interest rates and affordability concerns. However, the shortage of housing after over a decade of underinvestment following the Great Financial Crisis should prevent a disastrous decline in home prices. Lower-income consumers have been most impacted by the current inflationary environment, but consumer balance sheets remain generally healthy for the majority of Americans, and consumer credit quality remains strong at the moment. COVID mortality has improved and related pent-up demand is impacting many areas of the economy. These are reasons to believe a recession could be less significant than the previous two recessionary periods.
Following years of lower interest rates helping to drive ever-higher growth-stock valuations, we feel value investing is ripe for a period of outperformance. Further, given the recent market correction, we are finding opportunities to invest in quality businesses with solid balance sheets and cash flows, whose share prices have detached from our assessment of the fundamentals. The bargains inherent in the portfolio should attract acquirers and other investors over time.
Steadfast, we remain committed to making you money while aiming to protect your wealth.
Disclosures:
You should carefully consider the investment objectives, potential risks, management fees, and charges and expenses of the Fund before investing. The Fund’s prospectus contains this and other information about the Fund, and should be read carefully before investing. You may obtain a current copy of the Fund’s prospectus by calling 1.877.336.6763.
Past performance is not a guarantee of future results.
Important Risk Information
Investment in shares of a long/short equity fund have the potential for significant risk and volatility. A short equity strategy can diminish returns in a rising market as well as having the potential for unlimited losses. These types of funds typically have a high portfolio turnover that could increase transaction costs and cause short-term capital gains to be realized. The stocks in the Fund’s portfolio may decline in value or not increase in value when the stock market in general is increasing or decreasing in value and you could lose money. The Fund may lose money due to fluctuations within the stock market which may be unrelated to individual issuers and could not have been predicted. The price of the securities which the Fund holds may change unpredictably and due to local, regional, international, or global events. In the case of a general market downturn, multiple asset classes, or the entire market, may be negatively affected for an extended and unknown amount of time.
Risk Statistic Definitions:
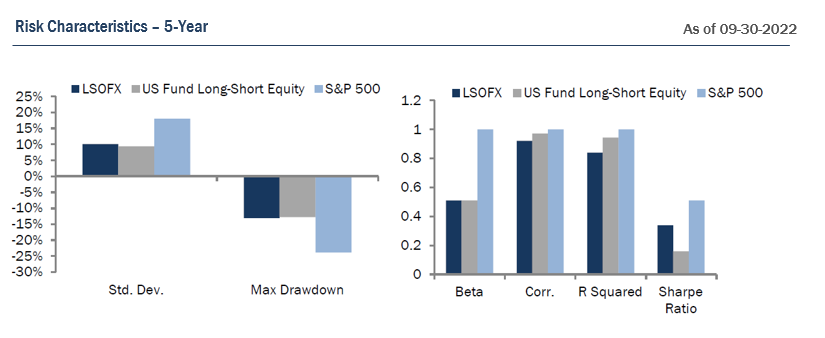
Standard Deviation measures the volatility of the Fund’s returns. Beta measures the Fund’s sensitivity to market movements. Sharpe Ratio uses the Fund’s standard deviation and average excess return over the risk-free rate to determine reward per unit of risk. R-squared represents the percentage of the portfolio’s movements that can be explained by general market movements. Upside/Downside Capture Ratio measures a manager’s ability to generate an excess return above the benchmark return in up markets and retain more of the excess return in down markets. Risk statistics are relative to the S&P 500. Batting Average is a statistical measure used to evaluate an investment manager’s ability to meet or beat their index. Omega is a relative measure of the likelihood of achieving a given return. Max Drawdown is the peak-to-trough decline during a specific recorded period of an investment. Gross Exposure is the sum of the absolute values of the fund’s long and short exposures. Net Exposure is the fund’s total long exposure less the fund’s total short exposure. The Expense Ratio, Gross of Any Fee Waivers or Expense Reimbursements, is 2.92%. The Expense Ratio, Net of Fee Waivers and Expense Reimbursements (contractual through 9/30/2023), is 2.89%. The Expense Cap is 1.95. The Adviser has contractually agreed to waive or limit its fees to 1.95% and to assume other expenses of the Fund until September 30, 2023, so that the ratio of total annual operating expenses (not including interest, taxes, brokerage commissions, other expenditures which are capitalized in accordance with generally accepted accounting principles, other extraordinary expenses not incurred in the ordinary course of business, dividend expenses on short sales, expenses incurred under a Rule 12b-1 plan, acquired fund fees and expenses and expenses that the Fund incurred but did not actually pay because of an expense offset arrangement) does not exceed 1.95%.
Prospector Partners, LLC assumed investment management duties on 05-28-2015 and was formally approved by shareholders on 09-17-2015.
Morningstar US Long Short Fund Category – Long-short portfolios hold sizable stakes in both long and short positions. Some funds that fall into this category are market neutral – dividing their exposure equally between long and short positions in an attempt to earn a modest return that is not tied to the market’s fortunes. Other positions that are not market neutral will shift their exposure to long and short positions depending upon their macro outlook or the opportunities they uncover through bottom-up research.
†† The Morningstar Rating for funds, or "star rating", is calculated for managed products (including mutual funds, variable annuity and variable life subaccounts, exchange-traded funds, closed-end funds, and separate accounts) with at least a three-year history Exchange-traded funds and open-ended mutual funds are considered a single population for comparative purposes It is calculated based on a Morningstar Risk-Adjusted Return measure that accounts for variation in a managed product's monthly excess performance, placing more emphasis on downward variations and rewarding consistent performance The top 10% of products in each product category received 5 stars, the next 22 5% receive 4 stars, the next 35% receive 3 stars, the next 22 5% receive 2 stars, and the bottom 10% receive 1 star. The Overall Morningstar Rating for a managed product is derived from a weighted average of the performance figures associated with its three-, five-, and 10-year (if applicable) Morningstar Rating metrics The weights are: 100% three-year rating for 36-59 months of total returns, 60% five-year rating/40% three-year rating for 60-119 months of total returns, and 50% 10-year rating/30% five-year rating/20% three-year rating for 120 or more months of total returns While the 10-year overall star rating formula seems to give the most weight to the 10-year period, the most recent three-year period actually has the greatest impact because it is included in all three rating periods. Across the US Long Short Equity category, as of 09/30/2022, LSOFX received the following Morningstar Rating™ for the 3-year, 5-year, 10-year periods, respectively: 3 stars out of 179 funds, 4 stars out of 158 funds, and 4 stars out of 59 funds.
The Fund is distributed by Ultimus Fund Distributors, LLC. (Member FINRA).
15849473-UFD-10/24/2022