First and foremost, we hope this writing finds you and your families healthy. It’s been a long twelve months and no one could be criticized for being happy to see the end of 2020. So much changed so quickly at the beginning of the year, as COVID-19 rapidly spread around the world, creating the first global pandemic of our lifetimes. Unfortunately, we all had to quickly learn to live in a “new normal” environment and lives were turned upside down. As most of us went into quarantine in March, quickly entering the lexicon were terms like: social distancing, herd immunity, flatten the curve, pantry loading, and distance learning… to name a handful.
For those of us in the investment management business, the information flow related to Covid-19 (spread of the virus, therapeutics, vaccines, etc.) was akin to drinking from a fire hose. The stock market that had already begun discounting news more rapidly in recent years accelerated from “warp speed to ludicrous speed” (forgive us for the “Space Balls” reference). Indeed, as the multi-trillion dollar stimulus plan started taking shape in the spring, and vaccine candidates entered Phase 1 trials, the market, which entered a bear market in record speed, quickly made a V-shaped bottom, charging higher and never looking back.
As referenced in our last writing, growth stocks dominated over their value brethren during 2020. This is contrary to history, where value stocks typically lead in the early years of an economic recovery. While we mentioned several potential catalysts which we felt could cause a rotation to value stocks (including the potential for increased inflation, rising interest rates and additional economic expansion) our conviction has only grown given the results of the recent U.S. elections. In the paragraphs to follow, we delve into why this is the case, and what we feel are the broader implications of the election.
Implications of the Blue “Ripple”
In November, a deeply divided nation went to the polls and voted to change administrations. Subsequently on January 5, 2021, the Georgia Senate runoff elections resulted in the Democrats taking control of the Senate, in addition to the Presidency and the House. This can have many implications on the economy and investing climate in the coming years. We believe this outcome, on the margin, will lead to a more rapid economic expansion, higher interest rates and inflation expectations, and a steeper yield curve. We regard this environment as constructive for value stocks in general, including cyclical companies and beaten down financial stocks. We expand on these thoughts below.
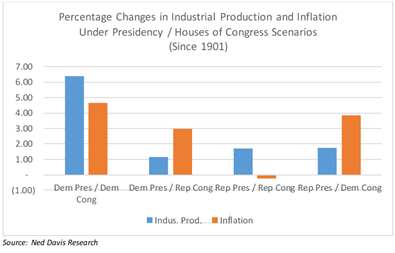
First off, as you could see in the following table, which includes data provided by Ned Davis Research (NDR), history would indicate that both industrial production and inflation run higher when we have both a Democrat president and control of Congress. Additionally, according to NDR, when the incumbent president loses office, this is typically a precursor for cyclical stocks outperforming. Their reason is logical - most often, a sputtering economy is the reason behind an incumbent losing out on a second term. Therefore, the new administration often makes that their number one priority and enacts legislation to boost the economy, which in turn, benefits cyclically-exposed companies.
While, undoubtedly, there are many factors that went into the current change in administrations, the state of the pandemic-impacted economy likely weighed heavily. And given that backdrop, we expect the incoming Biden administration to deliver an additional large stimulus package to bolster the economy as we attempt to bridge from the COVID-19 pandemic towards a “new normal” economy.
We also anticipate the Biden administration will push a $1 trillion+ infrastructure package early in his administration, given this was a top priority during his candidacy. While the slim majority Democrats hold in the Senate (a 50-50 tie with vice president Harris the tie-breaking vote) offers hurdles to getting an infrastructure bill passed, we expect that they will either be able to get it done (at least partially) via budget reconciliation, or as part of a stimulus package.
Trillions in additional stimulus dollars and/or infrastructure bill, both of which (in our view) have a better chance of getting done under a scenario where the White House and both Houses of Congress are held by the same party, would add inflationary fuel to an already expanding economy, and would likely lead to rising interest rates. A countervailing force under a Democratic administration could be higher taxes. However, in our opinion, with such a tight margin in the Senate, significant tax increases will be difficult to achieve…especially while we are still impacted by the pandemic. We don’t discount the potential for a rise in the corporate tax rate at some point - especially as part of a negotiation for a large infrastructure bill - however the threat of higher taxes in our minds is outweighed by the near-term impact of additional stimulus. Both parties also seem willing to let the deficit rise, and seem less worried than ever about “paying for” stimulus packages.
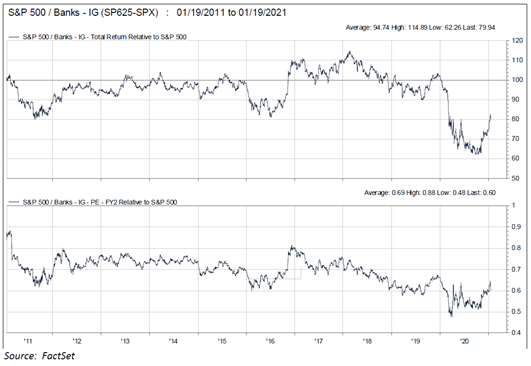
What does this all mean for your portfolio? While we did not make wholesale changes to the portfolio in anticipation of, or in reaction to the election outcome, we feel your portfolio is positioned well for the current environment. Increasing spending and deficits by the U.S. government should lead to rising inflation expectations and interest rates. We also expect a continued steepening in the yield curve given the Fed has indicated a willingness to keep short-term interest rates low until inflation goes above 2%. This should benefit financial service companies, including long out-of-favor banks which could see improving net interest margins. The economic expansion mitigates credit risk for the regional banks whose balance sheets are solid, both in terms of capital levels and ratios as well as a maintaining a strong reserving position. In last quarter’s letter, we detailed our increasing exposure to banks. While many of these holdings have rallied recently from bottom decile to bottom quintile absolute valuations, we still see significant upside. By way of reference, below we show the S&P 500 Bank Index’s relative performance and relative valuation over the past ten years.
The nascent recovery also portends good results out of the industrial, more cyclical, companies in your portfolio, especially those with exposure to COVID-depressed end markets such as commercial aerospace, auto, and energy where the prices remain depressed. These and other industrial companies could be significant beneficiaries of a large infrastructure bill, which is a pressing need and high priority of the incoming Biden administration. Recall that our criteria for investing in these companies includes a solid, low-leverage balance sheet, dependable free cash flow generation, an owner-oriented management team, and participating in an industry with active merger & acquisition activity.
The three holdings discussed in our 2Q20 letter, PPG Industries Inc. (PPG), Otis Worldwide Corp (OTIS), and General Dynamics Corp (GD), are examples of the aforementioned. Additionally, we would point to Carrier Global Corp. (CARR), and Eaton Corp. (ETN) – both of which should benefit from increased infrastructure spending. Notably, we would expect any infrastructure bill proposed by the Biden administration to include a great deal of clean/green energy spending. Both Carrier (a leader in HVAC systems) and Eaton (diversified power management) should both be beneficiaries as we see resulting building efficiency upgrades.
Other cyclically-exposed businesses which we either initiated or added to in the fourth quarter include Darden Restaurants, Inc. (DRI) and Parsley Energy (PE). We re-initiated a position in Darden, a company we view as a best-in-class operator, and have owned in the past. Darden, which operates the Olive Garden and LongHorn Steakhouse brands (among others), has been hurt during the pandemic, but has made great strides improving efficiency over the past year. Thus, we not only expect DRI to be a beneficiary from the “re-opening” of the economy as we come out of the COVID-19 crisis, but also expect them to be able to generate higher margins than before the pandemic.
We added to our Parsley Energy position during the quarter, as we looked to increase exposure to oil-exposed names once we gained comfort that OPEC was determined to act rationally (at their December meeting, OPEC opted to add only minimally to production in early 2021, allaying fears of dramatic supply increases). When we initially purchased PE, we viewed the company positively given the stock traded at a significant discount to net asset value under reasonable expectations for future oil prices, had a very solid balance sheet, is one of the lowest cost operators, and is exposed to prime Permian Basin assets – an area that has seen significant consolidation activity in recent years. After our initial purchases were made, PE agreed to be acquired by Pioneer Natural Resources (PXD), another low-cost Permian-based operator. We view the combination favorably, and feel the company will continue to benefit from a rise in oil prices as the economy continues to expand, and oil demand increases.
Investment Objective
The Fund seeks to achieve capital appreciation through a concentrated portfolio with an emphasis on financial services and insurance. Your portfolio also holds significant positions in stable, recession-resistant companies. Moreover, the consistently generated free cash flows make these companies attractive merger partners. The key principles that guide the investment philosophy are protection of the downside and value orientation. We have constructed your portfolio carefully with these principles in mind.
Outlook
2021 looks to be a transitional year. We are clearly in the early stages of a new economic cycle, following the coronavirus-induced recession of 2020. The rollout of efficacious Covid-19 vaccines during 2021 will allow the U.S. economy to return to more familiar footing with the resumption of dining out, air travel for business and pleasure, and large group gatherings. The recent United States elections, although closely contested, have ushered in a change in administration with attendant changes in the agenda around stimulus, spending, taxes, and trade. The razor-thin margins in Congress are likely to temper any radical policy shifts. Importantly the volatility emanating from the executive branch should ease.
Interest and mortgage rates continue near historically low levels, while inflation remains below target. We see early signs of reinflation in Treasury and TIP yields from the historically high levels of government spending here and around the world. We are carefully monitoring aggregate corporate debt levels (especially BBB- debt which is a single notch above junk status), currently above pre-2008 crisis levels and loom as a potential problem absent continued aggressive Fed support. Unemployment has shown improvement, but continues to be an issue.
In our estimation, overall equity valuations remain at elevated levels, due to the sharp decline in expected earnings for the rest of 2020 and into 2021, and the sharp rebound in equities. The high valuations of a small number of enormous technology companies certainly exert upward pressure to the overall averages. Recovery in aggregate earnings will take time as certain industries such as hospitality, entertainment, and travel are tied to the success of a vaccine rollout plan, and will take longer to return to pre-coronavirus levels. Treasury and high-grade corporate bond yields look unattractive after the dramatic flight to safety rally during 2020. In any case, value investing is ripe for a strong period of outperformance, and the bargains inherent in your portfolio should attract acquirers and other investors over time. Meanwhile, we still believe equities represent a superior asset allocation alternative to bonds over the longer term.
Steadfast, we remain committed to making you money while aiming to protect your wealth.
Portfolio Overview
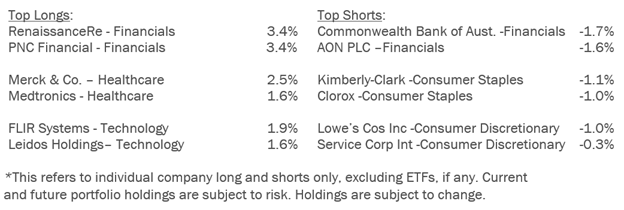
Top Holdings By Sector as of 12/31/2020
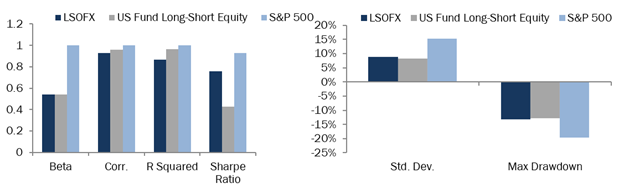
Risk Characteristics as of 12/31/2020
Disclosure
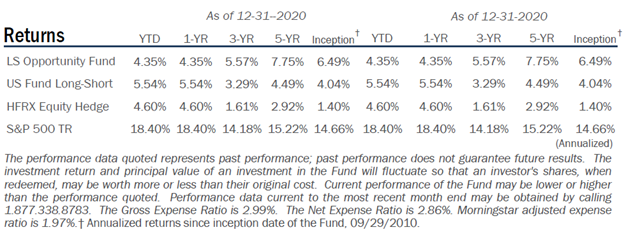
†† The Morningstar Rating for funds, or "star rating", is calculated for managed products (including mutual funds, variable annuity and variable life subaccounts, exchange-traded funds, closed-end funds, and separate accounts) with at least a three-year history Exchange-traded funds and open-ended mutual funds are considered a single population for comparative purposes It is calculated based on a Morningstar Risk-Adjusted Return measure that accounts for variation in a managed product's monthly excess performance, placing more emphasis on downward variations and rewarding consistent performance The top 10% of products in each product category received 5 stars, the next 22 5% receive 4 stars, the next 35% receive 3 stars, the next 22 5% receive 2 stars, and the bottom 10% receive 1 star. The Overall Morningstar Rating for a managed product is derived from a weighted average of the performance figures associated with its three-, five-, and 10-year (if applicable) Morningstar Rating metrics The weights are: 100% three-year rating for 36-59 months of total returns, 60% five-year rating/40% three-year rating for 60-119 months of total returns, and 50% 10-year rating/30% five-year rating/20% three-year rating for 120 or more months of total returns While the 10-year overall star rating formula seems to give the most weight to the 10-year period, the most recent three-year period actually has the greatest impact because it is included in all three rating periods. Across the US Long Short Equity category, the LS Opportunity Fund received 3 stars among 188 funds, 4 stars among 148 funds, and 4 stars among 49 funds for the 3-, 5-, and 10-year periods, respectively. Past performance is not a guarantee of future results. Risk Statistic Definitions: Standard Deviation measures the volatility of the Fund’s returns. Beta measures the Fund’s sensitivity to market movements. Sharpe Ratio uses the Fund’s standard deviation and average excess return over the risk-free rate to determine reward per unit of risk. R-squared represents the percentage of the portfolio’s movements that can be explained by general market movements. Upside/Downside Capture Ratio measures a manager’s ability to generate an excess return above the benchmark return in up markets and retain more of the excess return in down markets. Risk statistics are relative to the S&P 500. Batting Average is a statistical measure used to evaluate an investment manager’s ability to meet or beat their index. Omega is a relative measure of the likelihood of achieving a given return. Max Drawdown is the peak-to-trough decline during a specific recorded period of an investment. Gross Exposure is the sum of the absolute values of the fund’s long and short exposures. Net Exposure is the fund’s total long exposure less the fund’s total short exposure. The Gross Expense Ratio is 2.99%. The Net Expense Ratio is 2.86%. Morningstar adjusted expense ratio is 1.97%.The Expense Cap is 1.95%. The Adviser has contractually agreed to waive or limit its fees to 1.95% and to assume other expenses of the Fund until September 30, 2021, so that the ratio of total annual operating expenses (not including interest, taxes, brokerage commissions, other expenditures which are capitalized in accordance with generally accepted accounting principles, other extraordinary expenses not incurred in the ordinary course of business, dividend expenses on short sales, expenses incurred under a Rule 12b-1 plan, acquired fund fees and expenses and expenses that the Fund incurred but did not actually pay because of an expense offset arrangement) does not exceed 1.95%.
Prospector Partners, LLC assumed investment management duties on 05-28-2015 and was formally approved by shareholders on 09-17-2015.
Investment in shares of a long/short equity fund has the potential for significant risk and volatility. A short equity strategy can diminish returns in a rising market as well as having the potential for unlimited losses. These types of funds typically have a high portfolio turnover that could increase transaction costs and cause short-term capital gains to be realized.
Effective November 30, 2020, the Morningstar US Long Short Fund Index replaced the HFRX Equity Hedge Index as the Fund's performance benchmark because the Morningstar US Long Short Fund more closely aligns with the Fund's investment strategy and portfolio composition.
You should carefully consider the investment objectives, potential risks, management fees, and charges and expenses of the Fund before investing. The Fund’s prospectus contains this and other information about the Fund, and should be read carefully before investing. You may obtain a current copy of the Fund’s prospectus by calling 1.877.336.6763. The Fund is distributed by Ultimus Fund Distributors, LLC. (Member FINRA).
For Financial Professional Use Only.
11967068-UFD-01/26/2021