Current Market Environment
“This time is different.” As 2022 began, that sentiment seemed pervasive. With the S&P 500 trading close to all-time highs, continuing to be led by mega-cap technology and growth stocks, despite rising interest rates and worrisome inflation readings, the time-tested rule that ultimately, the stock market is a discounting mechanism, was seemingly being ignored. However, as the year progressed and inflation continued to surge, reaching a 40-year+ high of 9.0% in June, this time proved, unequivocally, not to be different. The Federal Reserve, in an effort to tamp down consumer prices, aggressively raised rates – ultimately by fully 425 basis points on the year. As interest rates continued to rise, the market rotated from "voting machine" to "weighing machine" (to once again use a favorite Benjamin Graham metaphor) as expected future cash flows were discounted at much higher interest rates and the present value of formerly nosebleed valuations were adjusted much lower. Against this backdrop, value stocks trounced growth (the S&P 500 Value Index's decline of 7% bested its growth counterpart by nearly 23%), and many of the leaders over the past decade were hit hardest. For example, the so-called “FAANG” stocks saw an average decline of over 46% for the year, with Apple, the best performer among the group, declining over 26%. Indeed, there was seemingly no place to hide in 2022 as both stocks and bonds fell by more than 10% for the first time on record according to Ned Davis Research.
As 2023 begins, the market remains on edge. An unprecedented pandemic brought with it unprecedented economic and social impacts. An abrupt, global shutdown in 2020 led to drastic reductions in economic activity, followed by an equally abrupt reopening, supply and labor shortages with corresponding inflationary effects – the results of which we are still feeling today. Central banks globally have been tightening policy as a result, and recession fears abound. According to a recent Morgan Stanley report, “of the 38 central banks around with world, 32 (or 84%) have hiked their main policy rate over the last six months”. Domestically, as we indicated in our last quarterly writing, we continue to fear the impacts of a potentially too-hawkish Fed. Although the CPI has declined month over month since the peak in June, it remains stubbornly high (over 6% at the last reading) and the employment market remains very tight. Meanwhile, the rapid rise in interest rates has caused the housing market to come to a virtual halt, as the 30-year mortgage rate, which ended 2021 at 3.31%, reached a high of 7.16% in October 2022 and remains well north of 6%. Other signs of cooling include the ISM Manufacturing Index, which recently registered a 48.4 (a level indicative of a contracting economy) and the ISM Services PMI index for December also indicated contraction after 30 months straight of growth. Despite this, the Federal Reserve has indicated an unwillingness to cease tightening until inflation is closer to their 2% target, and are willing to slow the economy considerably to do so.
Moreover, the Fed’s “dot plot” (the central bank’s own projection of where they estimate the Fed funds rate will be in the future) indicates a plan to hold rates flat in 2023 once the terminal rate of tightening is reached – a plan which implicitly assumes a relatively strong economy. However, market expectations are not as sanguine and predict an economy not able to withstand short-term interest rates at such a restrictive level. As can be seen in the table below, market expectations are for the Fed to cut rates several times in the back half of 2023.
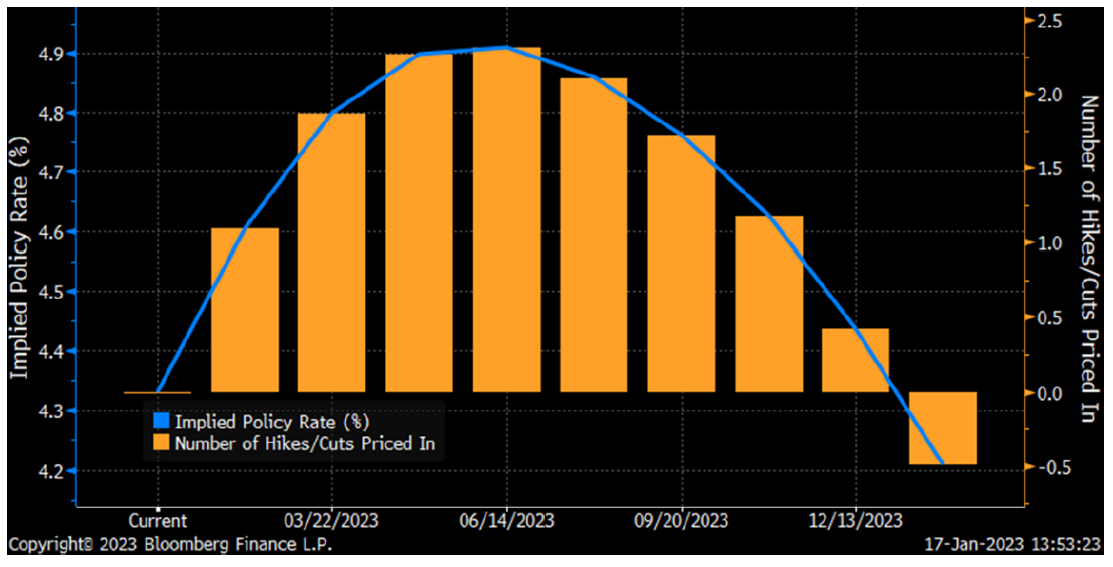
Thus, it seems the market shares our concerns of a Fed-induced recession. If the central bank does pivot in the coming months, it would not be surprising to see a knee-jerk rotation back into growth stocks and the tech leaders of the past decade. However, we are dubious this would be sustained, given there are many arguments to be made that we are in a “higher for longer” period when it comes to inflation and interest rates. Some of the major factors which impact our reasoning include:
- The Fed has only just begun their process of Quantitative Tightening. It is unknown what the impact of attempting to reduce their $9 trillion balance sheet will be. If they become more aggressive selling Treasuries, it could cause rates to rise above where they would otherwise be – just as rates were potentially artificially low during much of Quantitative Easing.
- China’s recent decision to abandon their “zero-COVID” policy and reopen the economy will likely fuel demand for autos, and other durable goods, real estate, etc. over the coming years. Given the size of China’s economy, potential for demand shocks exist, which could once again bring about inflationary supply / demand imbalances.
- Also related to China, a further chilling of our relationship with the country, especially when it comes to their intentions with Taiwan, could further the trend of domestic “onshoring” we have seen following COVID-induced supply chain disruptions, as more companies move manufacturing hubs and reliance on supplies away from China. This could serve to reverse decades of deflationary productivity gains.
- The Russia / Ukraine war remains an unknown, and an escalation by Putin could lead to further disruptions in the supply of energy, wheat, and other commodities, which would be additive to inflation.
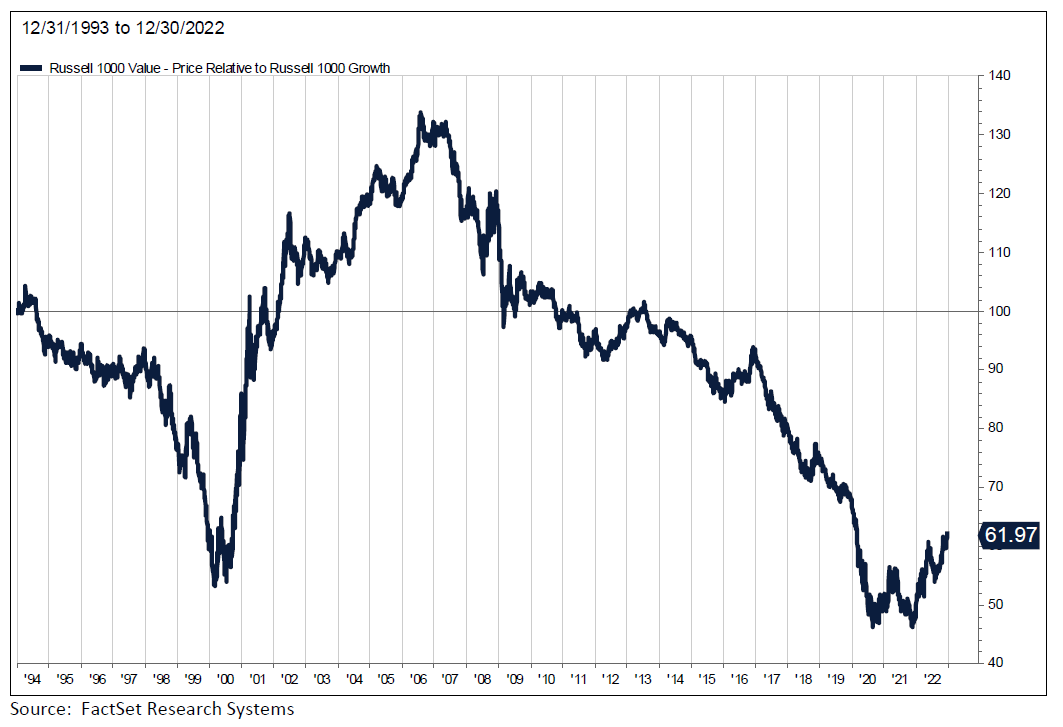
In addition to these above factors, historically, as can be seen in the chart below, once growth/value rotations happen, they typically last for years.
Portfolio Positioning
Despite all the unknowns, and persistent volatility, we are encouraged by the fact that once again fundamentals and valuations seem to matter. We are in a proverbial “stock-pickers’ market,” and the backdrop of volatility has allowed us to find mis-valued opportunities both on the long and short side. The environment has allowed us to add cyclically exposed, quality companies at what we feel are discount prices. This includes companies exposed to the auto, housing, and technology industries. Many names in these groups are down 30-50% from their highs and we think as the Fed pauses investors will seek out these beaten-up industries. Unsurprisingly, we have done this in our typical gradual fashion.
A key overweight in the portfolio is the property-casualty insurance sector. Your portfolio is long companies which are exposed to rising prices for insurance risk and whose investment income should also benefit from higher interest rates. This includes underwriters and insurance brokers, which we are net long about 12%. We believe renewals at 4/1, and mid-year will show continued strength, which will benefit your holdings.
Net exposure to lenders has decreased by about 11%, from a recent peak of around 15% to 4% at year- end 2022. We are concerned about rising credit and deposit costs along with marks on banks’ fixed income portfolios. However, the group is inexpensive on earnings and disliked by investors. This is in addition to the fact that capital levels remain healthy and bank underwriting has been conservative versus prior cycles. We will likely increase our exposure to this beaten up group as 2023 progresses.
We continue to be paired off within consumer staples. Our view is that investors are hiding in these durable cash flow names. However, they are trading rich relatively to their history, are facing trade down pressures, and as the Fed gets closer to a pausing we think there will be a rotation into early stage cyclical names.
Importantly, while we highlight sector-level movements, bottom-up analysis is essential, and we follow and find opportunities anywhere we see attractively priced businesses with conservatively-stated balance sheets and reliable cash flows. Needless to say, the current environment is keeping us very busy.
Investment Objective
The Fund seeks to achieve capital appreciation through a concentrated portfolio of long and short equity positions. The Fund’s long portfolio also holds significant positions in stable, recession-resistant companies. Moreover, the consistently generated free cash flows make these companies attractive merger partners. The key principles that guide the investment philosophy are focus on downside risk mitigation and value orientation. We have constructed your portfolio carefully with these principles in mind.
Outlook
Equity and bond market declines have been pronounced. The Federal Reserve has aggressively raised interest rates in an effort to lower inflation, and equity and bond markets are likely to remain volatile until investors sense the Fed is about to pivot to a less restrictive stance. The U.S. and rest of the world continue to manage the impacts of high inflation, Russia’s invasion of Ukraine, and China’s rotation from a “zero-COVID” policy. In our assessment, markets reflect a reasonably high probability of recession.
Employment remains strong. Supply / demand imbalances in the labor market bode well for the health of the consumer given full employment and the prospect for further wage gains, which partially mitigates the impact of inflation on the consumer. We expect continued pressure on housing prices as a result of higher interest rates and affordability concerns. However, the shortage of housing after over a decade of underinvestment following the Great Financial Crisis should prevent a disastrous decline in home prices. Lower-income consumers have been most impacted by the current inflationary environment, but consumer balance sheets remain generally healthy for the majority of Americans, and consumer credit quality remains strong at the moment. COVID mortality has improved and related pent-up demand is impacting many areas of the economy. These are reasons to believe a recession could be less significant than the previous two recessionary periods.
Following years of lower interest rates helping to drive ever-higher growth-stock valuations, we feel value investing is ripe for a period of outperformance. Further, given the recent market correction, we are finding opportunities to invest in quality businesses with solid balance sheets and cash flows, whose share prices have detached from our assessment of the fundamentals. The bargains inherent in your portfolio should attract acquirers and other investors over time.
Steadfast, we remain committed to making you money while aiming to protect your wealth.
Disclosures:
You should carefully consider the investment objectives, potential risks, management fees, and charges and expenses of the Fund before investing. The Fund’s prospectus contains this and other information about the Fund, and should be read carefully before investing. You may obtain a current copy of the Fund’s prospectus by calling 1.877.336.6763.
Past performance is not a guarantee of future results.
Important Risk Information
Investment in shares of a long/short equity fund have the potential for significant risk and volatility. A short equity strategy can diminish returns in a rising market as well as having the potential for unlimited losses. These types of funds typically have a high portfolio turnover that could increase transaction costs and cause short-term capital gains to be realized. The stocks in the Fund’s portfolio may decline in value or not increase in value when the stock market in general is increasing or decreasing in value and you could lose money. The Fund may lose money due to fluctuations within the stock market which may be unrelated to individual issuers and could not have been predicted. The price of the securities which the Fund holds may change unpredictably and due to local, regional, international, or global events. In the case of a general market downturn, multiple asset classes, or the entire market, may be negatively affected for an extended and unknown amount of time.
Risk Statistic Definitions:
Standard Deviation measures the volatility of the Fund’s returns. Beta measures the Fund’s sensitivity to market movements. Sharpe Ratio uses the Fund’s standard deviation and average excess return over the risk-free rate to determine reward per unit of risk. R-squared represents the percentage of the portfolio’s movements that can be explained by general market movements. Upside/Downside Capture Ratio measures a manager’s ability to generate an excess return above the benchmark return in up markets and retain more of the excess return in down markets. Risk statistics are relative to the S&P 500. Batting Average is a statistical measure used to evaluate an investment manager’s ability to meet or beat their index. Omega is a relative measure of the likelihood of achieving a given return. Max Drawdown is the peak-to-trough decline during a specific recorded period of an investment. Gross Exposure is the sum of the absolute values of the fund’s long and short exposures. Net Exposure is the fund’s total long exposure less the fund’s total short exposure. The Expense Ratio, Gross of Any Fee Waivers or Expense Reimbursements, is 2.92%. The Expense Ratio, Net of Fee Waivers and Expense Reimbursements (contractual through 9/30/2023), is 2.89%. The Expense Cap is 1.95. The Adviser has contractually agreed to waive or limit its fees to 1.95% and to assume other expenses of the Fund until September 30, 2023, so that the ratio of total annual operating expenses (not including interest, taxes, brokerage commissions, other expenditures which are capitalized in accordance with generally accepted accounting principles, other extraordinary expenses not incurred in the ordinary course of business, dividend expenses on short sales, expenses incurred under a Rule 12b-1 plan, acquired fund fees and expenses and expenses that the Fund incurred but did not actually pay because of an expense offset arrangement) does not exceed 1.95%.
Prospector Partners, LLC assumed investment management duties on 05-28-2015 and was formally approved by shareholders on 09-17-2015.
Morningstar US Long Short Fund Category – Long-short portfolios hold sizable stakes in both long and short positions. Some funds that fall into this category are market neutral – dividing their exposure equally between long and short positions in an attempt to earn a modest return that is not tied to the market’s fortunes. Other positions that are not market neutral will shift their exposure to long and short positions depending upon their macro outlook or the opportunities they uncover through bottom-up research.
†† The Morningstar Rating for funds, or "star rating", is calculated for managed products (including mutual funds, variable annuity and variable life subaccounts, exchange-traded funds, closed-end funds, and separate accounts) with at least a three-year history Exchange-traded funds and open-ended mutual funds are considered a single population for comparative purposes It is calculated based on a Morningstar Risk-Adjusted Return measure that accounts for variation in a managed product's monthly excess performance, placing more emphasis on downward variations and rewarding consistent performance The top 10% of products in each product category received 5 stars, the next 22 5% receive 4 stars, the next 35% receive 3 stars, the next 22 5% receive 2 stars, and the bottom 10% receive 1 star. The Overall Morningstar Rating for a managed product is derived from a weighted average of the performance figures associated with its three-, five-, and 10-year (if applicable) Morningstar Rating metrics The weights are: 100% three-year rating for 36-59 months of total returns, 60% five-year rating/40% three-year rating for 60-119 months of total returns, and 50% 10-year rating/30% five-year rating/20% three-year rating for 120 or more months of total returns While the 10-year overall star rating formula seems to give the most weight to the 10-year period, the most recent three-year period actually has the greatest impact because it is included in all three rating periods. Across the US Long Short Equity category, as of 12/31/2022, LSOFX received the following Morningstar Rating™ for the 3-year, 5-year, 10-year periods, respectively: 3 stars out of 177 funds, 4 stars out of 158 funds, and 4 stars out of 69 funds.
The Fund is distributed by Ultimus Fund Distributors, LLC. (Member FINRA).
16399315-UFD-02/08/2023