60/40 Has Treated Us Well
For the past 40 years, investors have favored a 60/40 portfolio allocation, where 60% is invested in equities and 40% invested in bonds. Investors were keen to this strategy, not because they favored the assets, but because it worked. A 60/40 allocation delivered consistently high returns with tolerable volatility. Bonds were a great counterpart to stocks because historically the two moved inversely to one another, providing a convenient hedge or investors.
The returns of this strategy were supercharged in recent years due to economic conditions pumping up the value of both these assets. Stocks enjoyed the lax monetary policy of low interest rates and extensive quantitative easing programs. Additionally, they benefitted from the decade of deficit spending following the ’08 recession that was accompanied by near-zero inflation. Equities’ counterpart, bonds, provided many advantages to investors. Bonds generated strong returns over the past several decades and carried less risk than equities.
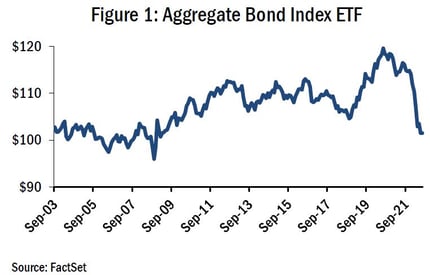
Figure 1 shows the US Aggregate Bond Index over the last 20 years. The index saw huge gains up until 2021. One factor contributing to these gains was the downward trend of interest rates. Ask interest rates decline, bond prices rise benefitting those holding bonds. The combination of these two assets has treated investors well, with an average annualized return of around 10% over the last 50 years.
So What’s Changed?
We are in a very different policy environment now than we were leading up to the COVID-19 Pandemic. Inflation is the highest in 40 years, and the Fed is reversing its policies to reign it in. Investors have reacted to this by selling bonds and stocks at the same time. The correlation between stocks and bonds, which is historically negative, has been positive since the beginning of the year and there is no guarantee it will revert back to being negative as the Fed’s interest rate posture grows more aggressive. And with nowhere to go but up, rising interest rates will continue to force bond prices down. Bonds’ counterpart, equities, face similar headwinds. High inflation has historically dampened stock market returns as well as contributed to volatility.
Figure 2: Excess Returns Over Cash Since
 Source: Bridgewater Associates
Another headwind facing stocks is the potential return of stagflation, which caused market-wide
panic in the ‘70s. If the correlation between stocks and bonds remains positive, investors will not have a hedge against downturns in either asset class. However, with an allocation to an a long short investing strategy, investors can potentially retain a hedge against equity and fixed income selloffs. All kings’ rules come to an end, but their legacy lives on. The 60/40 strategy may be dead, but that does not mean investors no longer want solid returns, it just means they must look elsewhere. Long short can potentially provide strong returns and low volatility for a portfolio; the 60/40 legacy lives on.
15277147-UFD-07/06/2022
The S&P 500 Index is a widely recognized, unmanaged index of equity prices and is representative of a broader market and range of securities than is found in the Fund’s portfolio. The Index is an unmanaged benchmark that assumes reinvestment of all distributions and excludes the effect of taxes and fees. Individuals cannot invest directly in this Index; however, an individual can invest in exchange traded funds or other investment vehicles that attempt to track the performance of a benchmark index. Standard Deviation is a measure of the dispersion of a set of data from its mean. Beta is a measure of the volatility of a portfolio relative to the overall market. Correlation is a statistical measure of how two securities move in relation to each other. Max Drawdown is the peak-to-trough decline during a specific record period of an investment.